Figures & data
Table 1. Composition of the formulated shrimp diets (g kg−1) supplemented with two brown seaweeds extracts.
Table 2. Mean (±SE) weight gain, specific growth rate and survival rate of P. monodon juveniles fed on brown seaweeds extract incorporated diets and control group (C).
Table 3. Anti V. parahaemolyticus activity of two brown seaweeds extracted by three different solvents – ethyl acetate, ethanol and methanol.
Figure 1. Percentages of mortality of P. monodon juveniles fed (a) P. tetrastromatica and (b) S. ilicifolium extracted diets and control diets after challenged with V. parahaemolyticus. EA5: ethyl acetate 5 g kg−1; E5: ethanol 5 g kg−1; M5: methanol 5 g kg−1; PC: positive control; BC: blank control; NC: negative control.
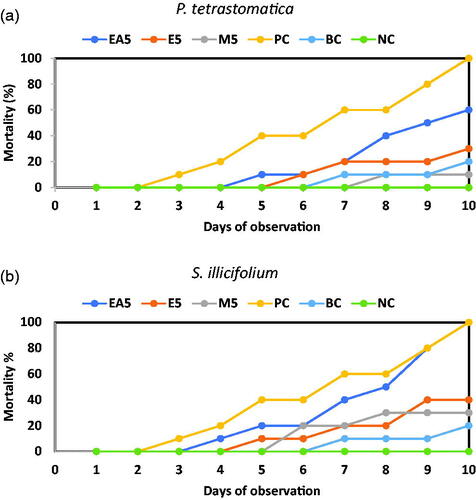
Figure 2. Mean haemolymph clotting time of P. monodon with (a) P. tetrastromatica and (b) S. ilicifolium incorporated diet after challenge. Data at the same exposure time with different letters are significantly different (p < .05) among different treatment groups. EA5: ethyl acetate 5 g kg−1; E5: ethanol 5 g kg−1; methanol 5 g kg−1; PC: positive control; BC: blank control; NC: negative control; AD: all died.
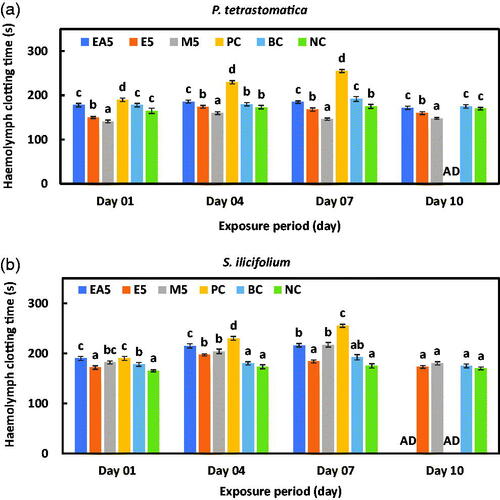
Figure 3. Total haemocyte count (THC) of P. monodon with (a) P. tetrastromatica and (b) S. ilicifolium incorporated diet after challenging with V. parahaemolyticus bacteria (1.0 mL of 106 cells) days onward. Data at the same exposure time with different letters are significantly different (p < .05) among different treatment groups. EA5: ethyl acetate 5 g kg−1; E5: ethanol 5 g kg−1; methanol 5 g kg−1; PC: positive control; BC: blank control; NC: negative control; AD: all died.
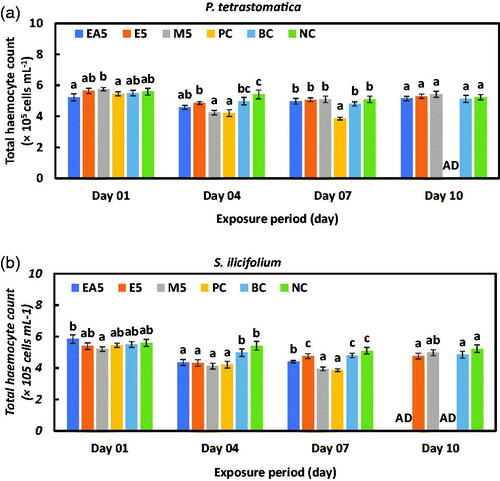
Figure 4. Phenol oxidase (PO) activity of haemocytes of P. monodon fed (a) P. tetrastromatica and (b) S. ilicifolium extracted immunostimulants diets and control diets after challenged with V. parahaemolyticus. Data at the same exposure time with different letters are significantly different (p < .05) among different treatment groups. EA5: ethyl acetate 5 g kg−1; E5: ethanol 5 g kg−1; methanol 5 g kg−1; PC: positive control; BC: blank control; NC: negative control; AD: all died.
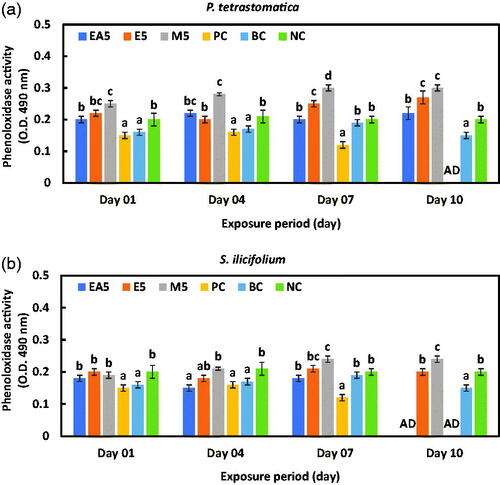
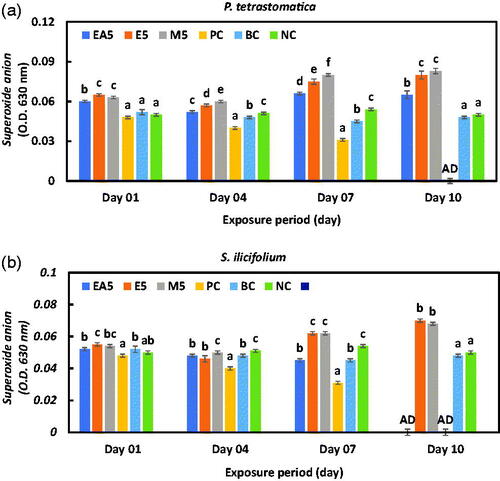
Figure 5. Intra-cellular superoxide (SO) anion production of haemocytes of P. monodon fed (a) P. tetrastromatica and (b) S. ilicifolium extracted immunostimulants diets and control diets after challenged with V. parahaemolyticus. Data at the same exposure time with different letters are significantly different (p < .05) among different treatment groups. EA5: ethyl acetate 5 g kg−1; E5: ethanol 5 g kg−1; methanol 5 g kg−1; PC: positive control; BC: blank control; NC: negative control; AD: all died.