
Figures & data
Table 1. Dietary nutrient concentrations used in central composite design response surface methodology to feed broiler chicks from 0 to 14 days of age.
Table 2. Sugar beet pulp (SBP), Tallow (T), and Soybean oil (SO) concentrations in experimental diets prepared according to a central composite design (3 levels, 3 factors) and corresponding experimental response values for ADG and FCR in broiler chicks from 0 to 7 days and 7 to 14 days of age.
Table 3. Composition of the experimental diets.
Table 4. Chemical composition of the experimental diets (calculated and determined analysis, %).
Table 5. Analysis of major fatty acids in tallow and soybean oil (%).
Table 6. Analysis of variance on the experimental results along with the contribution of each type of effect (linear, quadratic, and interaction) to the statistical fit in response surface model for ADG and FCR in broiler chicks from 0 to 7 days of age.
Table 7. Optimisation analysis on response surface model (RSM) to reach maximum ADG and minimum FCR in broiler chicks from 0 to 7 and 7 to 14 days of age.
Figure 1. Absolute t-value indicating contribution of each response surface model term to the statistical fit for average daily body weight gain (ADG) in broiler chicks. SBP: sugar beet pulp; T: tallow; SO: soybean oil (0–7 days of age); ns: not significant.
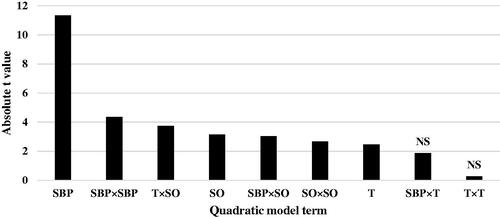
Figure 2. Absolute t-value indicating contribution of each response surface model term to the statistical fit for feed conversion ratio (FCR) in broiler chicks. SBP: sugar beet pulp; T: tallow; SO: soybean oil (0–7 days of age); ns: not significant.
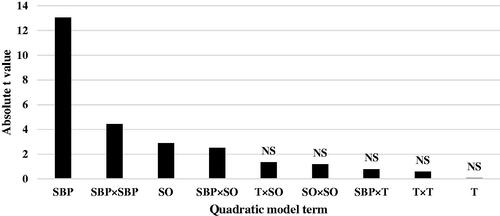
Table 8. Estimated parameters of response surface model for ADG and FCR in broiler chicks from 0 to 7 days of age.
Table 9. Analysis of variance on the experimental results along with contribution of each type of effect (linear, quadratic, and interaction) to the statistical fit in response surface model for ADG and FCR in broiler chicks from 7 to 14 days of age.
Figure 3. Absolute t-value indicating contribution of each response surface model term to the statistical fit for average daily body weight gain (ADG) in broiler chicks. SBP: sugar beet pulp; T: tallow; SO: soybean oil (0–7 days of age); ns: not significant.
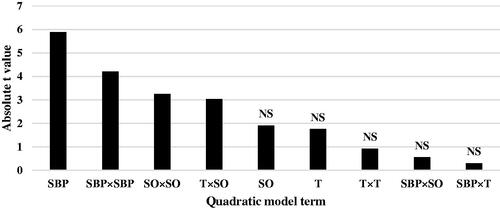
Figure 4. Absolute t-value indicating contribution of each response surface model term to the statistical fit for feed conversion ratio (FCR) in broiler chicks. SBP: sugar beet pulp; T: tallow; SO: soybean oil (0–7 days of age); ns: not significant.
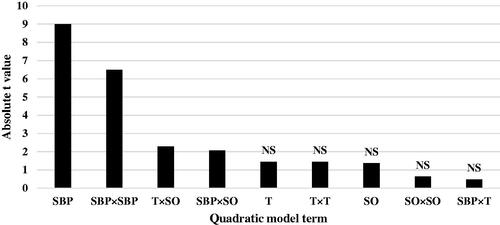
Table 10. Estimated parameters of response surface model for ADG and FCR in broiler chicks from 7 to 14 days of age.