Figures & data
Table 1. The mean, standard deviation (SD), the minimum and maximum value measured with digital and optical refractometers and radial immunodiffusion test (RID) in 85 Chianina beef–suckler calves from 9 farms in Umbria.
Figure 1. Correlation plot between: (A) serum total protein (g/L), determined by digital refractometry (DSTP), compared with serum IgG concentration (g/L) (n = 85; r = 0.84); (B) Brix percentage (%), determined by digital refractometry (DBRIX), compared with serum IgG concentration (g/L) (n = 85; r = 0.84); (C) Serum total protein (g/L), determined by optical refractometry (OSTP), compared with serum IgG concentration (g/L) (n = 85; r = 0.77); (D) Brix percentage (%), determined by optical refractometry (OBRIX), compared with serum IgG concentration (g/L) (n = 85; r = 0.75). Serum IgG (g/L) concentration was assessed by radial immunodiffusion (RID).
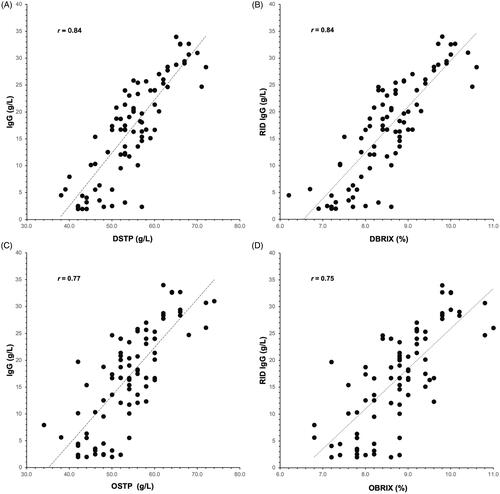
Figure 2. Receiver operating characteristics curves (ROC) used to determine optimal cut points for diagnosing inadequate transfer of passive immunity in Chianina beef–suckler calves (defined as a concentration of IgG in serum <16 g/L) for (A) concentration of serum total protein in serum (g/L; solid line, digital refractometer [DSTP]; dashed line, optical refractometer [OSTP]) and (B) %Brix (%; solid line, digital Brix refractometer [DBRIX]; dashed line, optical Brix refractometer [OBRIX]).
![Figure 2. Receiver operating characteristics curves (ROC) used to determine optimal cut points for diagnosing inadequate transfer of passive immunity in Chianina beef–suckler calves (defined as a concentration of IgG in serum <16 g/L) for (A) concentration of serum total protein in serum (g/L; solid line, digital refractometer [DSTP]; dashed line, optical refractometer [OSTP]) and (B) %Brix (%; solid line, digital Brix refractometer [DBRIX]; dashed line, optical Brix refractometer [OBRIX]).](/cms/asset/6b2543af-c408-4816-9ff2-20c6aa56241b/tjas_a_1884007_f0002_b.jpg)
Table 2. Diagnostic test characteristics for the digital and optical refractometers for assessing the failure of transfer of passive immunity (serum immunoglobulin G concentration <16 g/L) in 85 Chianina beef–suckler calves from 9 farms in Umbria.
Table 3. Predicted positive value (PPV) and negative predictive value (NPV) calculated for the digital and optical refractometers at the best cut point using different three different failure of passive transfer prevalence scenarios (5, 15, and 25%) defined as serum immunoglobulin G <16 g/L.
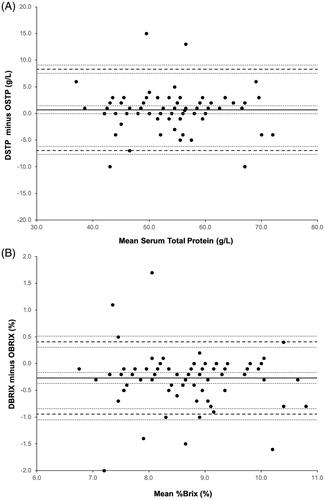
Figure 3. Bland–Altman plots showing the relationship between the difference between (A) serum total protein (STP, g/L) evaluated by digital (DSTP) and optical (OSTP) refractometer and the mean of the two values; (B) Brix percentage (%) evaluated by digital (DBRIX) and optical (OBRIX) refractometer and the mean of the two values. The black solid line indicates the mean difference between the 2 measures and the dotted lines represent 1.96 standard deviation from the mean difference. The top and bottom dashed grey line on each graph represent the 95% limits of agreement.