Figures & data
Figure 1. Evaluation of sperm capacitation status and acrosome reaction induction. (A) 4G10 phosphorylation patterns. Note the signal in the equatorial subsegment and acrosomal region (white arrow), pattern considered as ‘high capacitated’. (B) PNA-label. Spermatozoa with fluorescence in the acrosomal region was considered not reacted (−) and those with faint labelling in the equatorial segment were regarded as acrosome reacted (+).
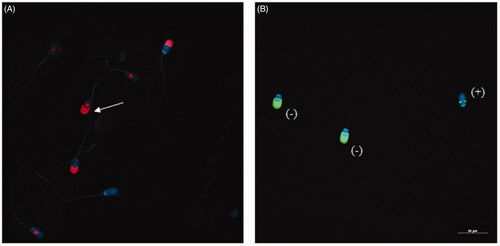
Table 1. Carbohydrates affinity of lectins used in this study.
Figure 2. (A) Different membrane domains identified in this study. ApR: apical ridge; AAc: acrosomal region; EqS: equatorial segment; PacA: anterior postacrosomal region; PacP: posterior postacrosomal region. Modified from Bruckbauer et al. (Citation2010). (B) Lectin staining patterns of boar sperm head. It is shown models of the staining pattern and the images taken by confocal microscopy (×63).
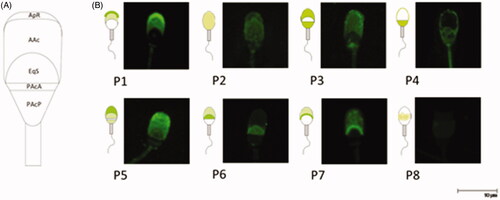
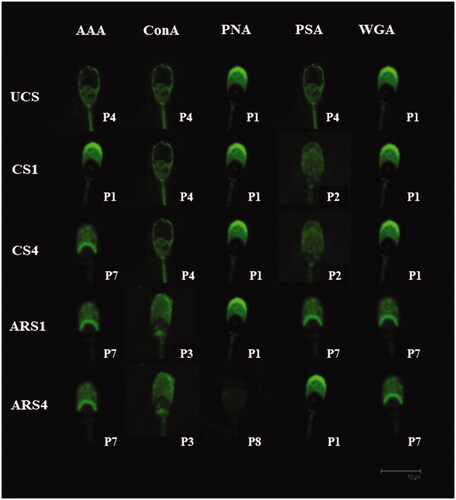
Figure 3. Distribution of the lectin-binding patterns in uncapacitated (UCS), one-hour-capacitated (CS1), four-hours-capacitated (CS4), induced acrosome reaction after one-hour-capacitation (ARS1) and induced acrosome reaction after four-hours-capacitation (ARS4) for each lectin used in this study.
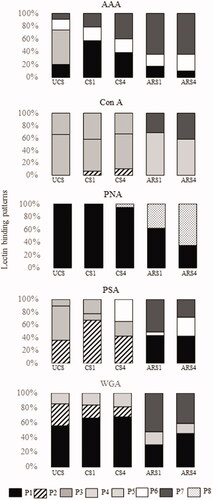
Figure 4. Principal lectin binding patterns for each in vitro physiological condition in boar sperm.