
Figures & data
Table 1. Chemical composition and quality traits (LS means) of normal, spaghetti meat, and wooden breasts of broiler chickens from three flocks that had been sampled at slaughtering.
Figure 1. Compression curves for raw fillets (a) and cooked fillets (b). Shear curves for the MORS test (c) and the Allo–Kramer test (d) on cooked fillets. WB: wooden breast; SM: spaghetti meat.
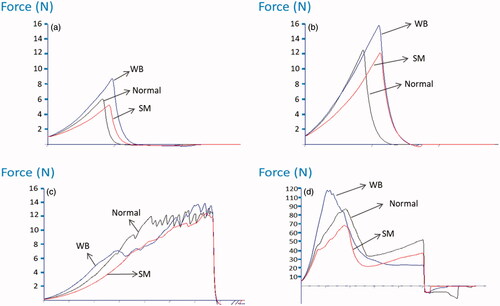
Table 2. Results of the compression, MORS, and Allo–Kramer tests on normal, spaghetti meat, and wooden breasts of broiler chickens from three flocks that had been sampled at slaughtering.
Supplemental material