Figures & data
Table 1. Nutritional standards of formula feed for pregnant sows (%).
Table 2. Definitions of pupillary light reflex indicators.
Table 3. Primer sequence.
Table 4. PLR indicators in left and right eyes of sows.
Figure 1. Neurophysiological Indicators levels in confined sows with different parity and different pupillary light reflex (PLR) characteristics, including neurophysiological indicators Among Confined Sows with Different PLR (A1, B1, C1), neurophysiological indicators Among Confined Sows with Different Parities (A2, B2, C2). The parities include parity 0 (P0), parity 2 (P2), and parity 5 (P5). The PLR characteristics include weak reflex (WR) and strong reflex (SR). Differences in the (A1, A2) serum cortisol (COR) level; (B1, B2) serum 5-hydroxytryptamine (5-HT) level; (C1, C2) serum dopamine (DA) level among different parity and different PLR groups in confined sows. The standard deviation is expressed by error bars, *p < .05.
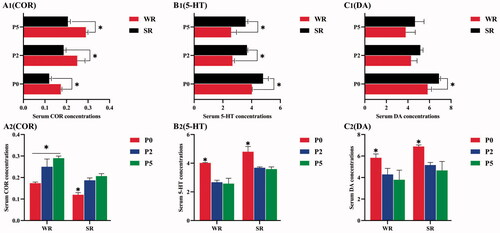
Figure 2. Immunoregulatory Factors levels in confined sows with different parity and different pupillary light reflex (PLR) characteristics, including immunoregulatory Factors Among Confined Sows with Different PLR (A1, B1, C1), immunoregulatory Factors Among Confined Sows with Different Parities (A2, B2, C2). The parities include parity 0 (P0), parity 2 (P2), and parity 5 (P5). The PLR characteristics include weak reflex (WR) and strong reflex (SR). (A1, A2) serum immunoglobulin A (IgA) level; (B1, B2) serum interleukin-6 (IL-6) level; (C1, C2) serum tumour necrosis factor-α (TNF-α) level among different parity and different PLR groups in confined sows. The standard deviation is expressed by error bars, *p < .05.
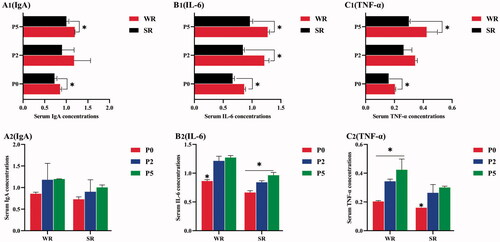
Figure 3. β-EP indicator levels in confined sows with different parity and different pupillary light reflex (PLR) characteristics, including β-EP Among Confined Sows with Different PLR (A1), β-EP Among Confined Sows with Different Parities (A2). The parities include parity 0 (P0), parity 2 (P2), and parity 5 (P5). The PLR characteristics include weak reflex (WR) and strong reflex (SR). Differences in the (A1, A2) serum beta-endorphin (β-EP) level among different parity and different PLR groups in confined sows. The standard deviation is expressed by error bars, *p < .05.
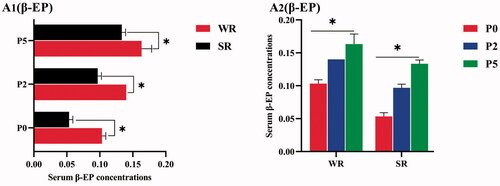
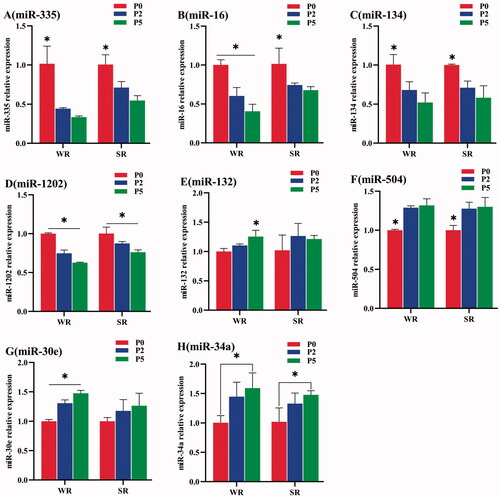
Figure 4. Relative miRNA expression in sows with different PLR characteristics but the same parity. (A) The relative expression of miR-335; (B) miR-16; (C) miR-134; (D) miR-1202; (E) miR-132; (F) miR-504; (G) miR-30e; and (H) miR-34a. The standard deviation is expressed by error bars, *p < .05; **p < .01.
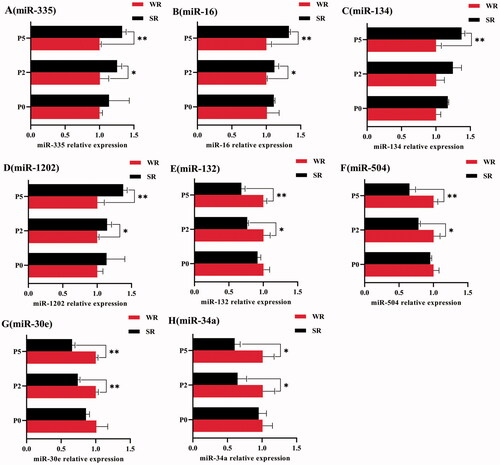
Figure 5. Relative miRNA expression among sows with different parities but the same PLR characteristics. (A) The relative expression of miR-335; (B) miR-16; (C) miR-134; (D) miR-1202; (E) miR-132; (F) miR-504; (G) miR-30e; and (H) miR-34a. The standard deviation is expressed by error bars, *p < .05.