Figures & data
Figure 1. Schematic diagram of the study and proteomic workflow.
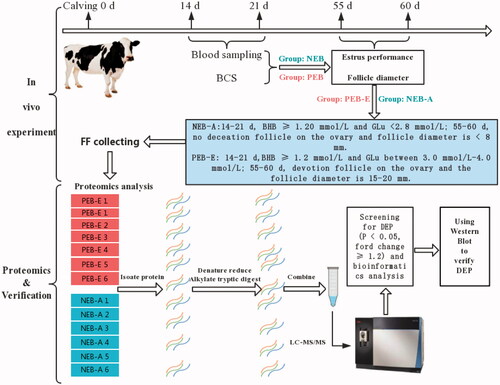
Table 1. Dairy cow background information and serum biochemical indicators.
Figure 2. Principal component analysis. The abscissa is the PC1 (Principal Component Analysis 1) result, and the ordinate is the 553 PC2 (Principal Component Analysis 2) result. Red represents the NEB-A group, and blue represents the PEB-E group. A difference was found between the FF (Follicular fluid) samples of NEB-A and PEB-E.
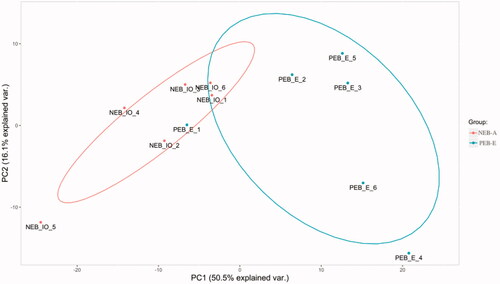
Figure 3. Differentially expressed protein (DEP) volcano map and cluster map. The abscissa is the fold change of the DEP difference between the two groups, and the ordinate is the p value in protein expression. Green represents a downregulated protein, red represents an upregulated protein, and blue represents a protein with no difference.
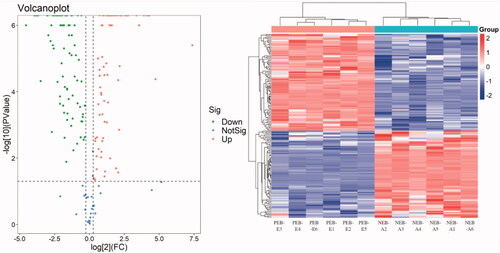
Figure 4. Statistics of Clusters of Orthologous Groups (COG) function classification. The abscissa shows the COG function classification, and the ordinate shows the number of proteins by functional classification.
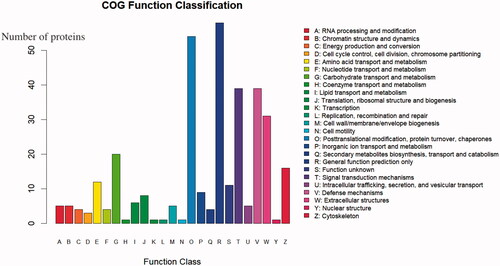
Figure 5. GO (Gene Ontology) analysis of DEPs (differentially expressed proteins) . Green represents biological process, red represents cellular process, and blue represents molecular process. The highest MF enrichment of DEPs is metal ion binding and ATP binding, the highest enrichment of CC (cellular component) is the extracellular region, and the functions of higher BP (biological process) enrichment are cell adhesion, positive regulation of ERK1 and ERK2 cascade, and positive regulation of apoptotic process.
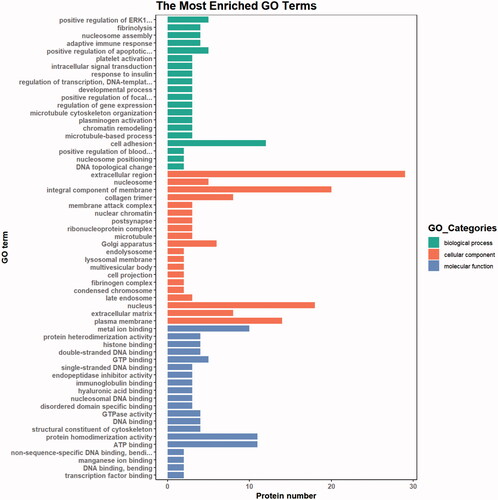
Figure 6. KEGG pathway enrichment. The ordinate represents the name of the enrichment pathway, and the abscissa is the ratio. The larger is the circle, the more the protein is enriched, and different colours represent different p values.
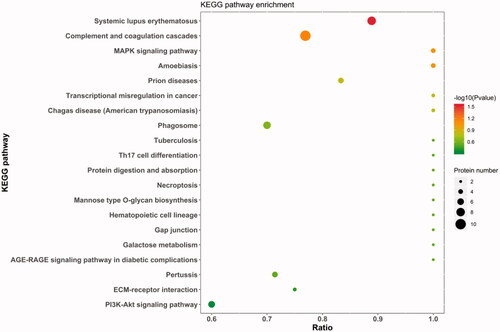
Figure 7. PPI (protein-protein interaction network) network interaction map of DEPs(differentially expressed proteins). Red represents upregulated proteins, and green represents downregulated proteins. Each dot represents a DEP. The figure shows the IDs of the DEPs. Details are available in Schedule 1, and the protein details are found in Supplementary Schedule 1 according to the ID.
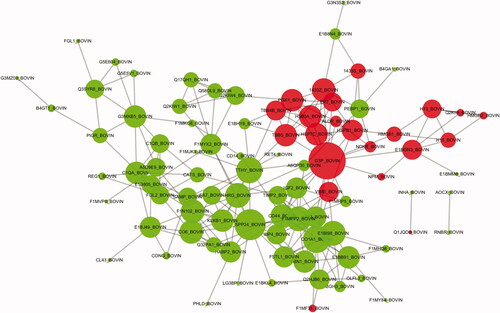
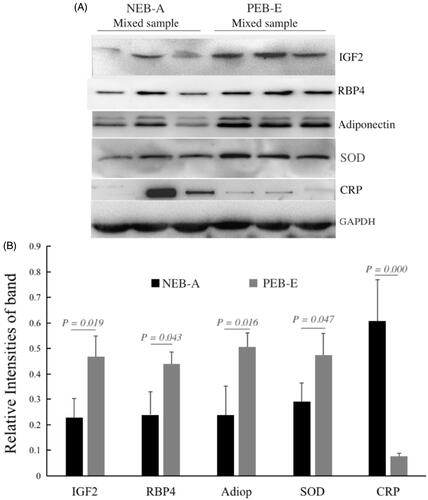
Figure 8. DEP western blotting verification results. Internal reference protein: GAPDH (glyceraldehyde-3-phosphate dehydrogenase); verification proteins: RBP4 (retinol-binding protein 4), adiponectin B (Adipo B), SOD (superoxide dismutase), IGF2 (insulin-like growth factor 2), CRP (C-reactive protein). A is the WB result: NEB-A Mixed sample represents the protein mixed sample of the NEB-A group FF in the proteomics test (n = 3), and PEB-E Mixed sample represents the FF of the PEB-E group in the proteomics test of protein mixed samples (n = 3); each group is loaded with 20 µg of protein. B shows the results of greyscale analysis: the Western Blot results of the five validated proteins were consistent with the proteomics results.