
Figures & data
Table 1. Ingredients and nutrients composition of experimental diets.
Figure 1. The house ambient temperature during the experimental period.
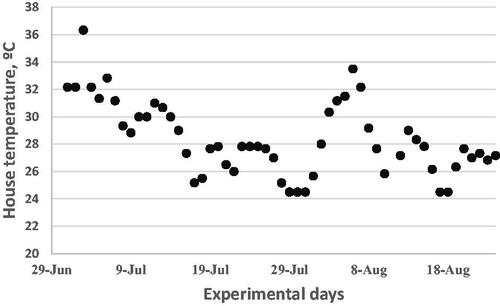
Table 2. Effect of diet nutrients density on egg production, egg weight, and egg mass of laying hens during the post-peak production phase of the first laying cycle under subtropical summer conditionsa.
Table 3. Effect of diet nutrients density on feed intake, feed efficiency, and body weight of laying hens during the post-peak production phase of the first laying cycle under subtropical summer conditionsa.
Table 4. Effect of diet nutrients density on economic performance of laying hens during the post-peak production phase of the first laying cycle under subtropical summer conditionsa.
Table 5. Calculated daily absolute intakes of ME and selected nutrients in the laying hens during the post-peak production phase of the first laying cycle under subtropical summer conditionsa.
Table 6. Effect of diet nutrients density on egg quality of laying hens during the post-peak production phase of the first laying cycle under subtropical summer conditionsa.
Table 7. Effect of diet nutrients density on egg composition of laying hens during the post-peak production phase of the first laying cycle under subtropical summer conditionsa.
Figure 2. Fitted broken-line plot of hen-day egg production of Hy-line-W36 laying hens during the post-peak production phase of the first laying cycle under subtropical summer conditions as a function of diet nutrients density (% of strain recommendation). The break point occurred at 97.62 ± 1.02, p < 0.001, R2 = 0.58 with linear broken line model.
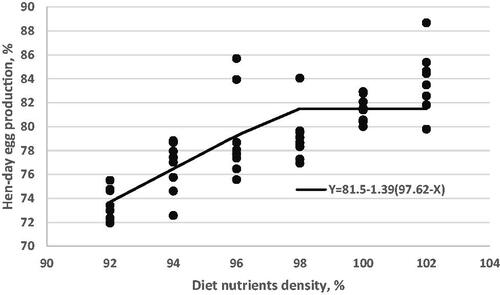
Figure 3. Fitted broken-line plot of average egg weight of Hy-line-W36 laying hens during the post-peak production phase of the first laying cycle under subtropical summer conditions as a function of diet nutrients density (% of strain recommendation). The break point occurred at 99.54 ± 2.92, p < 0.011, R2 = 0.18 with linear broken line model.
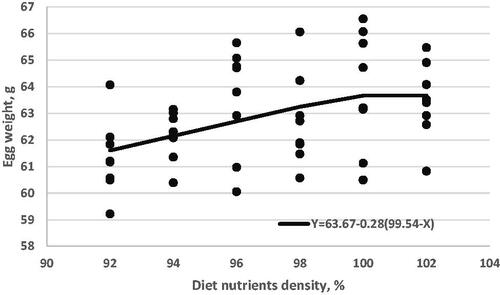
Figure 4. Fitted broken-line plot of egg mass of Hy-line-W36 laying hens during the post-peak production phase of the first laying cycle under subtropical summer conditions as a function of diet nutrients density (% of strain recommendation). The break point occurred at 97.20 ± 0.99, p < 0.001, R2 = 0.51 with linear broken line model.
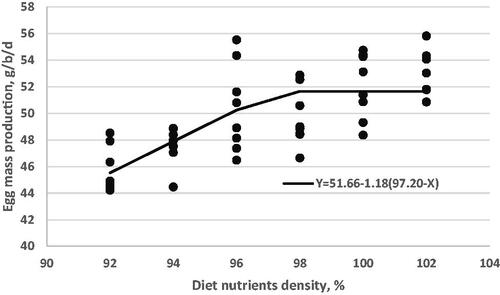
Figure 5. Fitted broken-line plot of feed conversion ratio of Hy-line-W36 laying hens during the post-peak production phase of the first laying cycle under subtropical summer conditions as a function of diet nutrients density (% of strain recommendation). The break point occurred at 100 ± 1.01, p < 0.001, R2 = 0.66 with linear broken line model.
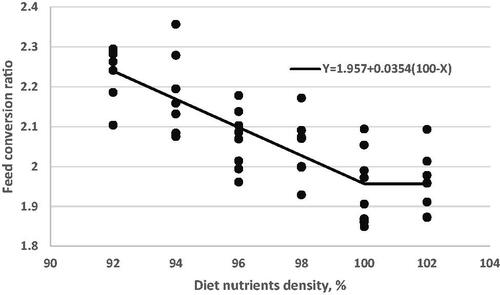
Table 8. Estimated metabolisable energy and nutrients requirements of laying hens during the post-peak production phase of the first laying cycle under subtropical summer conditions by the linear broken-line fit model.