
Figures & data
Figure 1. The mean age, expressed in days, at the diarrhoea onset (TDE) for group C (n = 20 calves) and for group T (n = 20 calves). C: control group or group C; T: tannin-treated group or group T. Different letters denote a significant difference (a ≠ b: p < .05).
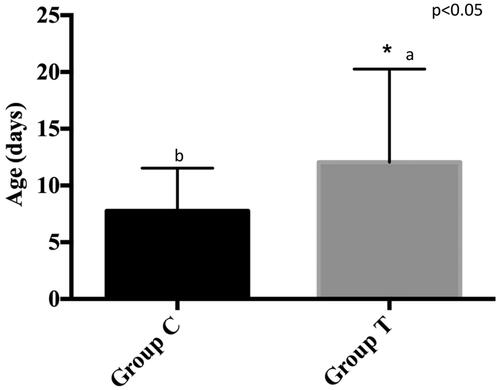
Figure 2. Days with diarrhoea as the relative percentage of the total observation period (60 days). C: control group or group C; T: tannin-treated group or group T. D: diarrhoea; ND: no diarrhoea; Chi-square test. Different letters denote a significant difference (a ≠ b: p = .001).
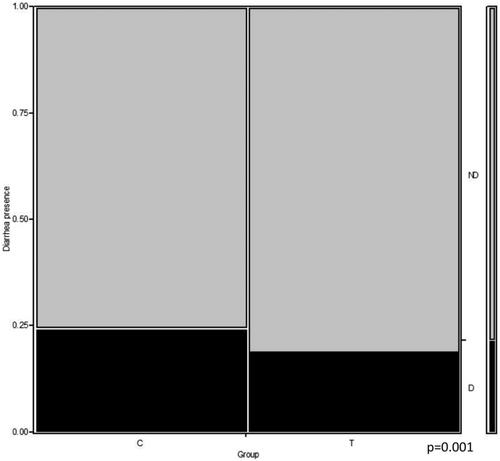
Table 1. The median, minimum (m) and maximum (M) values regarding the frequency of diarrhoeic episodes expressed as the number of diarrhoeic episodes per calf during the study period and the median faecal score for Group C and Group T.
Table 2. Results of the gamma-glutamyl transferase (GGT) concentration expressed as LSmean ± standard error for group C (n = 20 calves) and group T (n = 20 calves).
Table 3. Results of albumin (ALB) concentration expressed as LSmean ± standard error for group C (n = 20 calves) and group T (n = 20 calves).
Table 4. Results of aspartate aminotransferase (AST) concentration expressed as LSmean ± standard error for group C (n = 20 calves) and group T (n = 20 calves).