Figures & data
Figure 1. Experimental design of females synchronised using intravaginal progestagen sponges without any contact with males (Control Group), and females synchronised using the same treatment and submitted to the "male effect" during the breeding season at 48 hours (48H, very early follicular phase), 72 hours (72H, early follicular phase), 4 days (4 D, early luteal phase), 13 days (13 D, luteal phase), and 18 days (18 D, late luteal phase) after sponge removal.
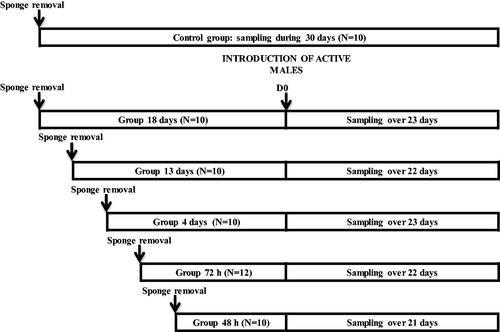
Figure 2. Evolution of progesterone concentrations (ng/mL) in females synchronised using intravaginal progestagen sponges without any contact with males (Control Group, A), and females synchronised using the same treatment and submitted to the "male effect" during the breeding season at 48H (very early follicular phase, B), 72H (early follicular phase, C), 4 D (early luteal phase, D), 13 D (luteal phase, E), and 18 D (late luteal phase, F) after sponge removal. The arrow indicates the moment of the introduction of males to the groups.
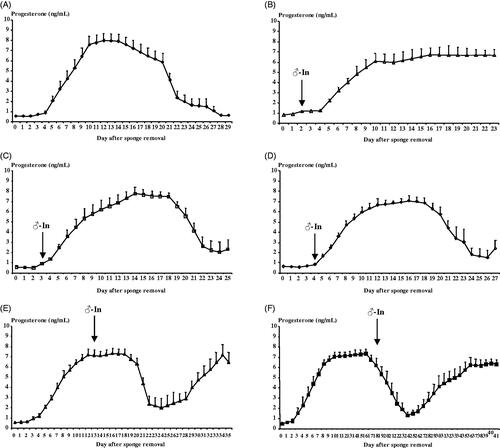
Figure 3. Evolution of Non-esterified fatty acids (NEFAs) concentrations (mg/dL) in females synchronised using intravaginal progestagen sponges without any contact with males (Control Group, ◆), and females synchronised using the same treatment and submitted to the "male effect" during the breeding season at 48H (very early follicular phase, △; (A)), 72H (early follicular phase, □; (B)), 4 D (early luteal phase, ⋄; (C)), 13 D (luteal phase, ▲; (D)), and 18 D (late luteal phase, ■; (E)) after sponge removal. The arrow indicates the moment of the introduction of males to the groups. *p<.05; **p<.01; ***p<.001.
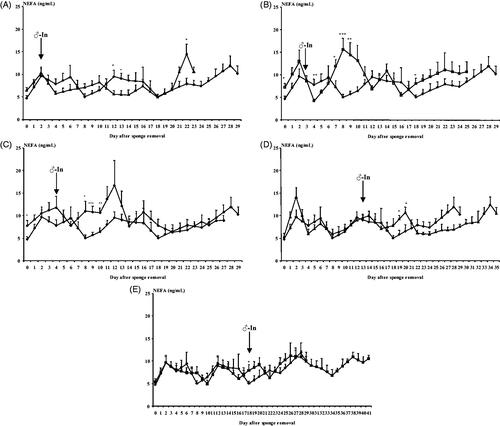
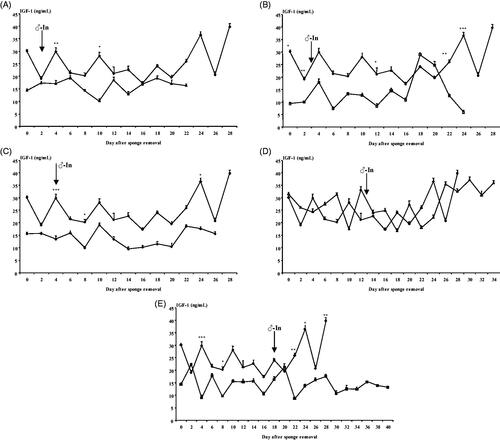
Figure 4. Evolution of Insulin-like growth factor-I (IGF-1) concentrations (ng/mL) in females synchronised using intravaginal progestagen sponges without any contact with males (Control Group, ◆), and females synchronised using the same treatment and submitted to the "male effect" during the breeding season at 48H (very early follicular phase, △; (A)), 72H (early follicular phase, □; (B)), 4 D (early luteal phase, ⋄; (C)), 13 D (luteal phase, ▲; (D)), and 18 D (late luteal phase, ■; (E)) after sponge removal. The arrow indicates the moment of the introduction of males to the groups. *p<.05; **p <.01; ***p<.001.