
Figures & data
Table 1. Chemical composition of the diet used during the experimental period.
Table 2. Composition of ingredients used in the animals' diet during the experiment.
Table 3. Ruminal kinetics of the dry matter of the ingredients and the experimental diet.
Table 4. Means (minimum–maximum) of the climatic variables during the experimental period.
Figure 1. Respiratory rate (± standard error of the mean for each treatment) in Nellore cattle finished in feedlot on different shading strategies in the pen and times throughout the day (interaction between assessment strategies and times: p = .18).
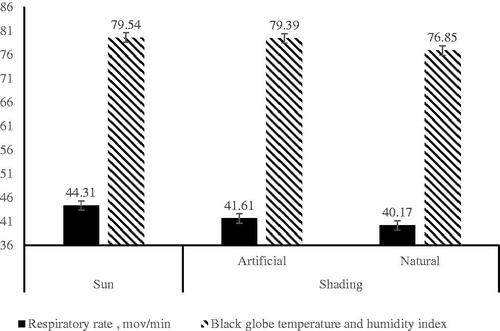
Figure 2. Respiratory rate (± standard error of the mean for each treatment) of Nellore cattle finished in feedlot on different shading strategies in the pen and times throughout the day (interaction between assessment strategies and times: p = .18).
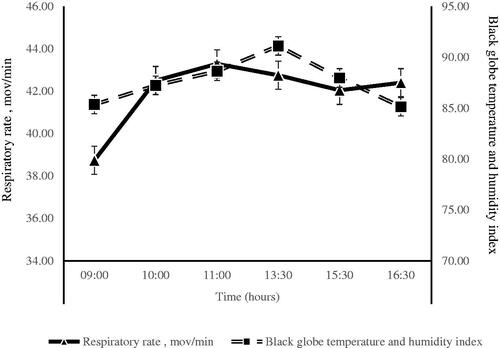
Table 5. Intake and digestibility of nutrients in Nellore cattle finished in feedlot on different shading strategies in the pen.
Table 6. Ingestive behaviour of Nellore cattle finished in feedlot on different pen shading strategies.
Table 7. Ingestive behaviour of Nellore cattle finished in feedlot on different shading strategies in the pen.
Table 8. Productive performance and efficiency of Nellore cattle finished in feedlot on different shading strategies in the pen.