
Figures & data
Table 1. Specifications of the calibration curve used for fresh harvested pre-ensiling maize (n = 205), by the use of a poliSPECNIR near infrared system.
Figure 1. PC1 and PC2 biplot from PCA algorithm.
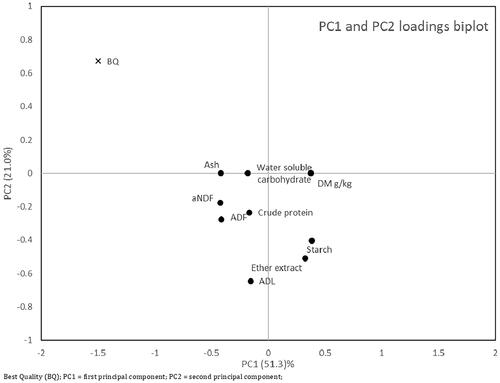
Table 2. Specifications of the fresh whole corn plant, pre-ensiling dataset.
Table 3. Specifications of the post-ensiled dataset.
Table 4. Fermentation quality index (FQI) of maize silage belonging to different FAO classes (class 200 vs. class 600–700), grown in different yield potential areas (low vs. medium vs. high) and harvested at different Maturity (early, EH vs. medium, MH vs. late, LH).
Table 5. Composition of the fresh whole plant maize belonging to different FQI classes (NEQ, EQ).
Table 6. Results of stepwise regression of constituents for FQI: estimated regression coefficients, intercept of the model and P (R2 = 0.48 for the training dataset and 0.55 for reduced dataset).
Figure 2. scatter plot for the outcomes of the CDA (Can1 and Can2) for the samples of the original dataset, considering the three classes for FQIc. (A) Green filled area = ‘lower’; red filled area = ‘good’; blue filled area = ‘excellent’. (B) Green filled area = ‘lower’; red filled area = ‘good or excellent’. Ellipses represent a 95% confidence interval.
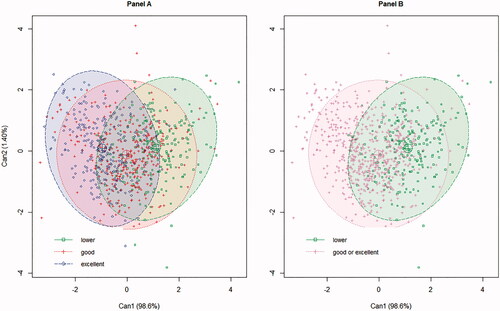
Table 7. Confusion matrix for CDA in the original dataset (n = 797, 25 incomplete records removed) and in the reduced dataset (n = 101, 7 incomplete records removed) for FQIc, classified in three levels.
Figure 3. scatter plot for the outcomes of the CDA (Can1 and Can2) for the samples of the reduced dataset, in the three classes for FQIc. (A) green filled area = “lower”; red filled area = “good”; blue filled area = “excellent”. (B) Green filled area = “lower”; red filled area = “good or excellent”. Ellipses represent a 95% confidence interval.
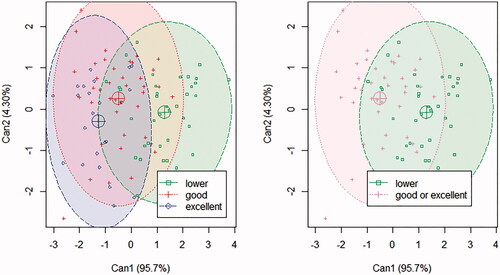
Table 8. confusion matrix for PLS-DA, SVMs and KNN algorithms, validated on the testing set of FQIc.