
Figures & data
Table 1. Ingredients and estimated nutrient content of the adaptation diet supplied to beef cattle.
Table 2. Average chemical composition of the diets provided to animals of each pen (n = 164).
Table 3. Fitting statistics of modified partial least squares regression models in leave-one-out cross-validation for chemical parameters in total mixed ration for beef cattle.
Table 4. Average chemical composition of the pre-exsiccated faeces collected from the animals of each pen (n = 172).
Table 5. Fitting statistics of modified partial least squares regression models in leave-one-out cross-validation for chemical composition in beef cattle pre-exsiccated faeces.
Table 6. Average total-tract apparent (tta) nutrients digestibility estimated (De, %) using dietary and faecal uNDF as an internal marker (n of matches= 164).
Table 7. Fitting statistics of modified partial least squares regression models in leave-one-out cross-validation for total-tract apparent (tta) nutrients digestibility estimated (De, %) using undigestible NDF as a marker in total mixed ration for beef cattle.
Table 8. Fitting statistics of modified partial least squares regression models in leave-one-out cross-validation for total-tract apparent (tta) nutrients digestibility estimated (De, %) in cattle faeces.
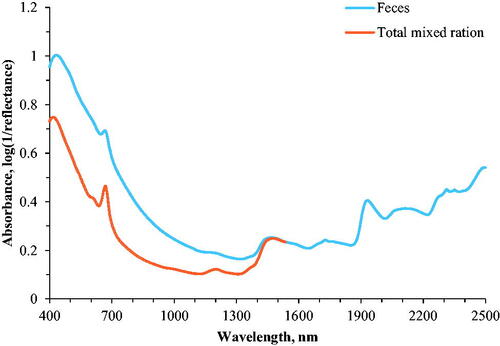
Figure 1. Average raw spectra of pre-exsiccated faeces and total mixed rations from NIRS DS2500 spectrometer.
Data availability statement
The data that support the findings of this study are available from the corresponding author upon reasonable request.