
Figures & data
Figure 1. Map of the sampling sites: red circles urban sites, yellow circle suburban sites; blue circles suburban-rural sites.
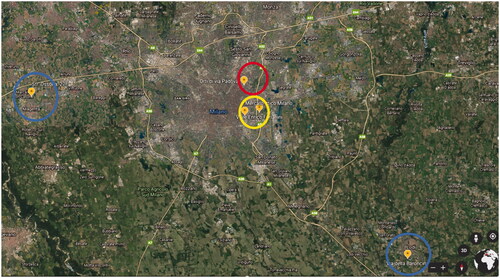
Table 1. Beehive locations and ARPA monitoring stations considered in the survey.
Table 2. Mean, minimum and maximum values for Cd and Pb on bees in the five sites during the six monitoring months.
Table 3. Mean Cd and Pb (± SEM) measured on bees in the different sites, over the trial (June–July 2017).
Table 4. Mean atmospheric concentration of Cd and Pb measured by municipal monitoring units, calculated on the 30 d before bees collection.
Figure 2. Concentrations of atmospheric Cd and its content on bees located in the city of Milan (Orti di via Padova) (the beehive is 1.65 km far from the monitoring station of Milan,Città Studi and 5 km from the monitoring station of Milan, Senato).
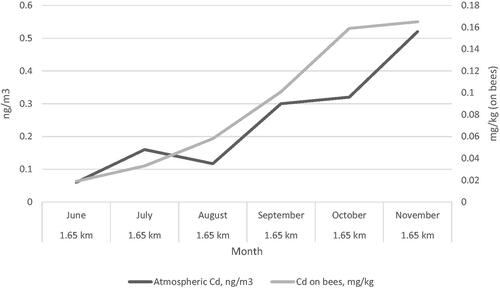
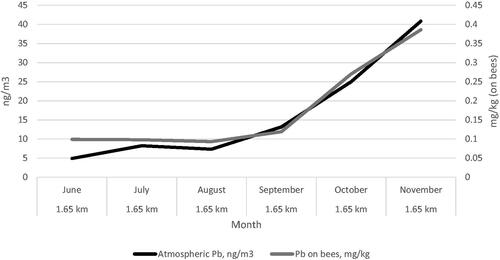
Figure 3. Concentrations of atmospheric Pb and its content on bees located in the city of Milan (Orti di via Padova, the beehive is 1.65 km far from the monitoring station of Milan, Città Studi and 5 km from the monitoring station of Milan, Senato).
Data availability statements
The data that support the findings of this study are available on request from the corresponding author, AC.