
Figures & data
Table 1. GC-MS analysis of green tea ethanolic extract (GTEE) components.
Table 2. Ingredients and chemical composition of the basal diet used in the in vitro systems (g/kg DM).
Table 3. Primer design characteristics used for PCR amplification of rumen microorganisms.
Figure 1. Pattern of the effects of different levels of green tea ethanol extract (GTEE) on ruminal gas production kinetics.
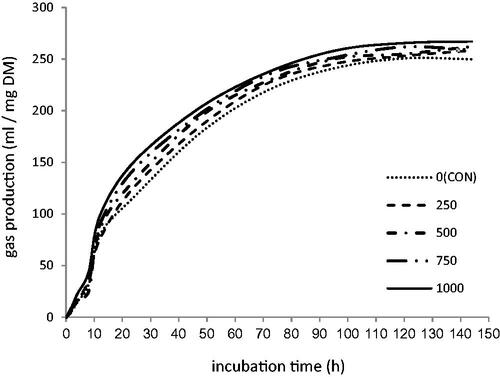
Table 4. Effects of different doses of green tea ethanolic extract (GTEE) on gas and methane production, pH, and N-NH3 concentration.
Table 5. Effects of different doses of green tea ethanolic extract (GTEE) on VFA concentrations.
Figure 2. Effects of green tea ethanol extract (GTEE) on rumen microbial Population change (%) relative to the control. SEM was 8.14, 7.26, and 9.07 for protozoa, fungi, and methanogenic archea, respectively (a). SEM was 6.34, 7.21, and 5.12 for F.succinogenes, R. albus, and R. flavefaciens, respectively (b). SEM was 5.07, 6.23, and 3.71 for B. fibrisolvents, P. ruminicola, and S. ruminantium, respectively(c).
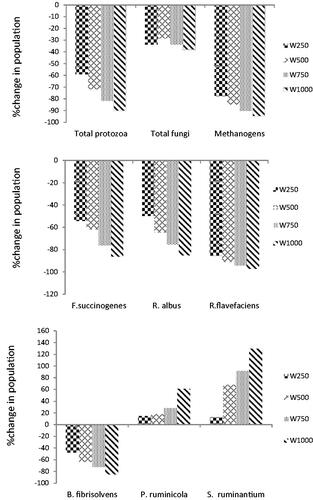
Figure 3. Effects of different doses of green tea ethanolic extract (GTEE) and incubation time on in vitro digestibility of AIVDMD (a), TIVDMD (b), and TIVOMD (c). Means followed by different letters are significantly different according to Tukey’s multiple range tests (p < .05).
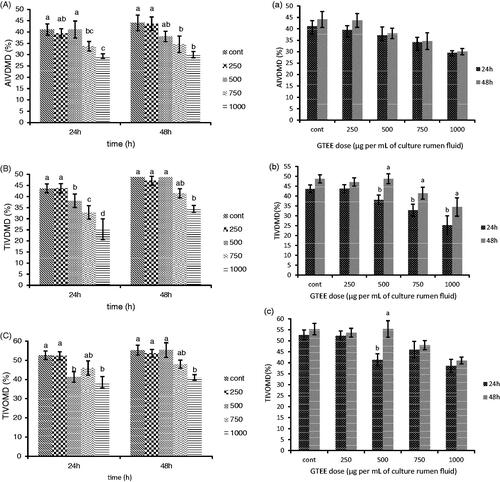
Table 6. Effects of different doses of green tea leave ethanolic extract (GTEE) on the control of lactic acidosis.
Data availability statement
The data that support the findings of this study are available on request from the corresponding author, R. Pirmohammadi. The data are not publicly available due to their containing information that could compromise the privacy of research participants.