Figures & data
Table 1. The effect of the early-life oral administration of probiotics on the mortality and exclusion rate of piglets in the experiment.
Table 2. The effect of the oral early-life administration of probiotics on the body weight and growth performance of piglets in the pre-weaning phase.
Figure 1. Venn diagram: number of unique and common amplicon sequence variants (ASVs) of sows and piglets at d7 and d18.
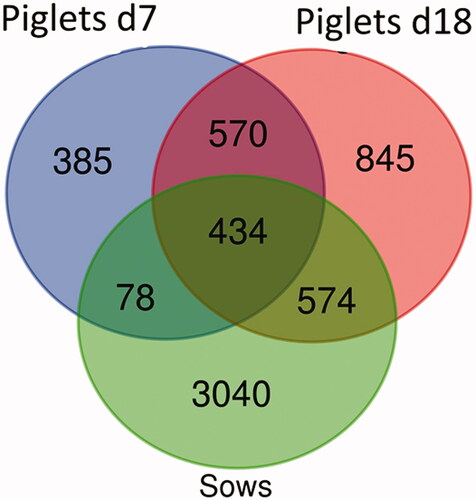
Figure 2. Chao1, Shannon and InvSimpson alpha indices of piglets divided into the four experimental groups and the two time points. Groups: CO = 4 ml of pure water; SA= 4 mL of solution containing a total of 1 × 10¹⁰ CFU of Saccharomyces cerevisiae var. boulardii CNCM-1079 (Lallemand Animal Nutrition); EF = 4 mL of solution containing a total of 1 × 10¹⁰ UFC di Enterococcus faecium lactiferm WS200 (Chr Hansen) and SAEF 4 mL of solution containing the mix of two probiotics (1 × 10¹⁰ CFU of Saccharomyces cerevisiae var. boulardii CNCM-1079 and 1 × 10¹⁰ CFU of Enterococcus faecium lactiferm WS200).
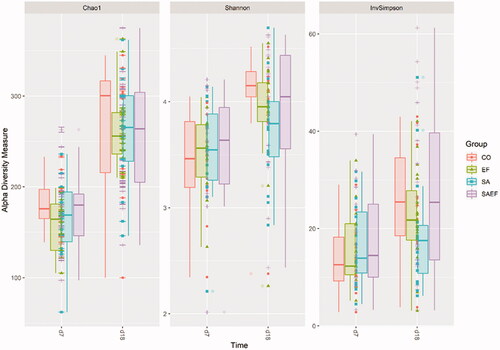
Table 3. The results of the Adonis test for time and oral early-life administration of probiotics in the faecal microbiota of suckling piglets.
Table 4. The effect of the oral early-life administration of probiotics on the faecal microbial taxa of suckling piglets at day 7.
Table 5. The effect of the oral early-life administration of probiotics on the faecal microbial taxa of suckling piglet at day 18.
Figure 3. The results of the PLS-DA analysis on the faecal microbiota of piglets at d7. (A) Individual score plot of the samples along the first two components. (B) Table reporting the most discriminant genera per group; Value.var expresses the variance explained by the single genera; Freq, expresses the frequencies by which the genera were chosen among the 100 repetitions of the cross validation; PC stands for the principal component which discriminates the genera; Direction expresses the group for which the genera were discriminated. (C and D) Contribution plot represented the contribution of each genus on the first and second component, respectively. Genus contribution ranked from bottom (most important) to top. Groups: CO = 4 ml of pure water; SA= 4 mL of solution containing a total of 1 × 10¹⁰ CFU of Saccharomyces cerevisiae var. boulardii CNCM-1079 (Lallemand Animal Nutrition); EF = 4 mL of solution containing a total of 1 × 10¹⁰ UFC di Enterococcus faecium lactiferm WS200 (Chr Hansen) and SAEF 4 mL of solution containing the mix of two probiotics (1 × 10¹⁰ CFU of Saccharomyces cerevisiae var. boulardii CNCM -1079 and 1 × 10¹⁰ CFU of Enterococcus faecium lactiferm WS200).
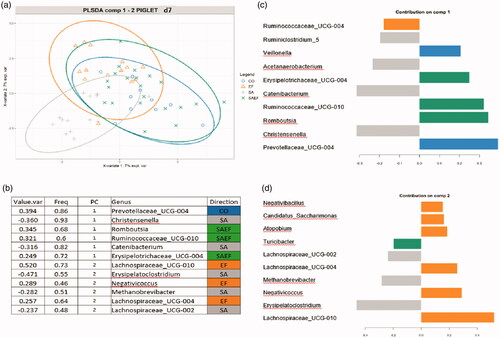
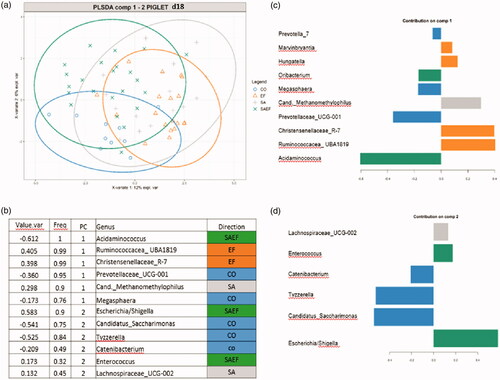
Figure 4. The results of the PLS-DA analysis on the faecal microbiota of the piglets at d18. (A) Individual score plot of the samples along the first two components. (B) Table reporting the most discriminant genera per group; Value.var expresses the variance explained by the single genera; Freq, expresses the frequencies by which the genera were chosen among the 100 repetitions of the cross validation; PC stands for the principal component which discriminates the genera; Direction expresses the group for which the genera were discriminated. (C and D) Contribution plot represented the contribution of each genus on the first and second component, respectively. Genus contribution ranked from bottom (most important) to top. Groups: CO = 4 ml of pure water; SA= 4 mL of solution containing a total of 1 × 10¹⁰ CFU of Saccharomyces cerevisiae var. boulardii CNCM-1079 (Lallemand Animal Nutrition); EF = 4 mL of solution containing a total of 1 × 10¹⁰ UFC di Enterococcus faecium lactiferm WS200 (Chr Hansen) and SAEF 4 mL of solution containing the mix of two probiotics (1 × 10¹⁰ CFU of Saccharomyces cerevisiae var. boulardii CNCM -1079 and 1 × 10¹⁰ CFU of Enterococcus faecium lactiferm WS200).