
Figures & data
Figure 1. Lysine content and ratio of the other essential amino acids to lysine in the pools of colostra collected from sows of the different parity class in the farm.
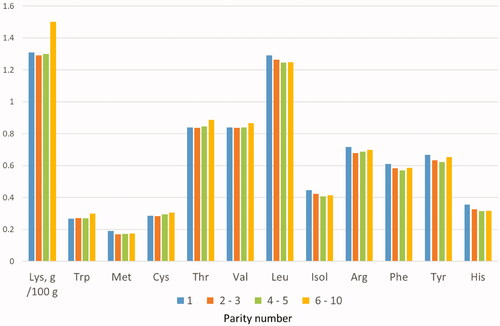
Figure 2. Comparison between the ratio of amino acids to lysine (=100) in colostra obtained in the farm (general mean of pooled samples) and sow mature milk (NRC Citation2012).
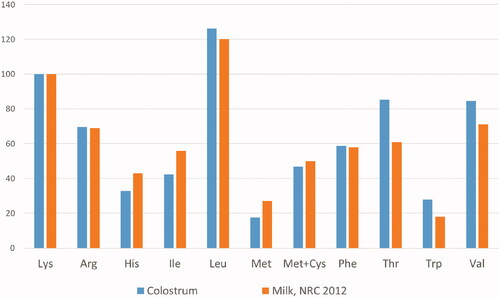
Table 1. Composition of colostrum pools used in the preliminary test for the assessment of colostrum composition.
Table 2. Ingredient composition and calculated nutrient contents of the control diet and of the supplemented transition diet.
Table 3. Influence of amino acid supplementation to the diet of transition sow on litter characteristics and survival.
Table 4. Influence of amino acid supplementation to the diet of transition sow on the composition of colostrum.
Table 5. Back fat and muscle depth in the two groups of sows at the start of the trial and at weaning.
Table 6. Influence of amino acid supplementation to the diet of transition sow on the concentration of immunoglobulins (Ig) of colostrum and saliva.
Figure 3. Alpha diversity for the index of Chao1, Shannon and Simpson in the two dietary groups of sows. Chao1 index differed for p = .031.
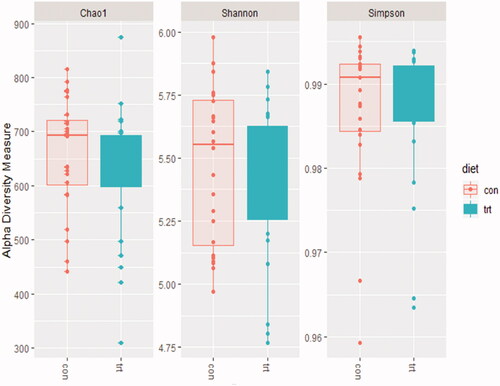
Table 7. Results for Adonis test for the diet and parity classTable Footnotea effect on faecal microbiota of sows.
Figure 4. NMDS plot for the effect of diet and parity class using the Bray–Curtis matrix of distance.
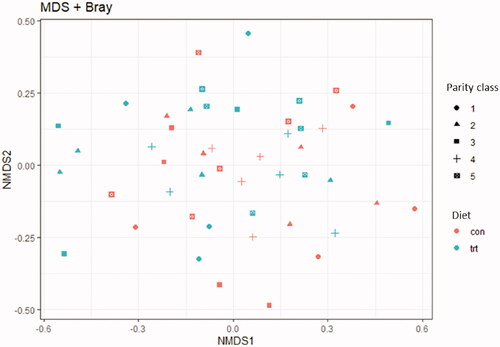
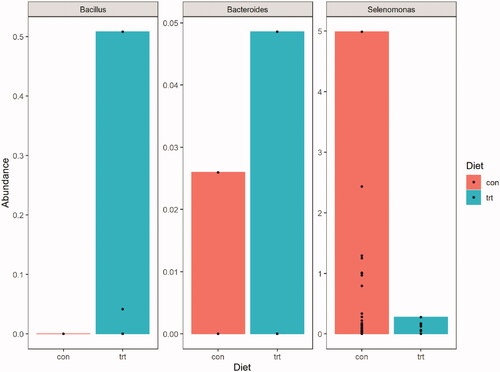
Figure 5. Box plots for the mean relative abundances of taxa differently expressed between control and treated group.
tjas_a_1960210_sm2186.docx
Download MS Word (1,012.4 KB)Data availability statement
The datasets on microbiota data are available in the PiGutNet area of the European Nucleotide Database (ENA) repository with the number PRJEB43707. The other derived data supporting the findings of this study are available from the corresponding author [PB] on request.
Funding
Project F61–Reg.(UE)1305/2013–PSR 2014/2020 DGR Emilia-Romagna n.227/2017– FOCUS AREA 3A–Operazione 16.2.01 (Coordinator: Agricola Tre valli). The funder had no role in study design, data collection and analysis, decision to publish, or preparation of the manuscript.