
Figures & data
Table 1. Fish welfare markers, weighting categories and ranges of weighting scores used in semantic modelling (adapted from Stien et al. Citation2013).
Table 2. Welfare indicators (WI), the levels for each indicator, and the corresponding indicator level score (IS), the calculated weighting factor (WF), and the relative weighting factor (RWF).
Figure 1. Image of European sea bass with OWI of 1.0, showing normal individual-specific welfare indicators.
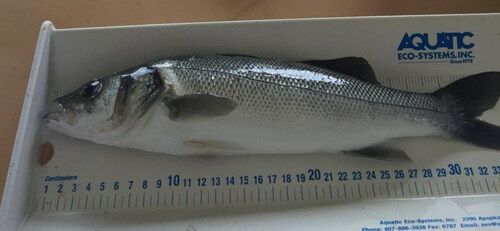
Figure 2. European sea bass examples with lower OWI values. (a) OWI of 0.88 (IWS for parasite presence = 0 due to the visible copepod parasites in the gills); (b) OWI of 0.93 (IWS for skin condition = 0.10 due to scale loss; (c) OWI of 0.88 (IWS for fin condition = 0 due to loss of pectoral fin).
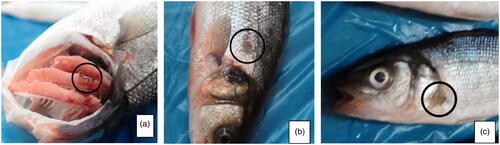
Table 3. Indicator welfare scores (IWS) and overall welfare index (OWI) for cage specific indicators.
Table 4. Total overall welfare index (OWI) for E. sea bass from farm A and farm B.