
Figures & data
Table 1. Ingredients, chemical composition and particle size of treatments.
Figure 1. Mean dry matter (DM) intake (kg) in calves (15 per treatment) fed diets with different forage to concentrate ratio. Error bars represent the standard error of the mean at each time point. Values are shown separately for Holstein calves fed diet forage-to-concentrate ratio of 50:50 (F50; ●); forage-to-concentrate ratio of 35:65 (F35; ^), and forage-to-concentrate ratio of 20:80 (F20; ▼). During the study, p-values for the linear effects of treatments, day and interaction between treatments and day were .008, < .0001 and .89, respectively and SEM was .050.
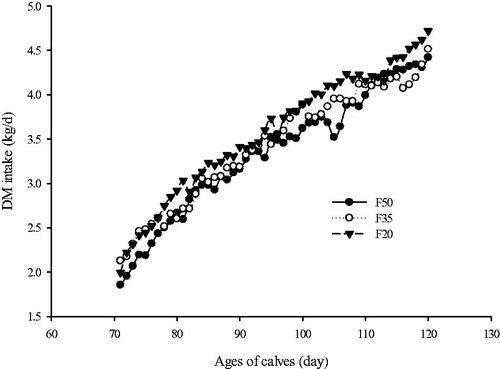
Table 2. Dry matter intake, energy intake, body weight (BW), average daily gain (ADG), and feed conversion ratio for weaned Holstein heifers (n = 15 per treatment) fed diets with different forage to concentrate ratio.
Table 3. Ruminal pH (n = 15 per treatment) and total tract nutrient digestibility (n = 8 per treatment) for weaned Holstein heifers fed diets with different forage to concentrate ratio.
Table 4. Structural parameters for weaned Holstein heifers (n = 15 per treatment) fed diets with different forage to concentrate ratio.
Table 5. Plasma metabolites for weaned Holstein heifers (n = 8 per treatment) fed diets with different forage to concentrate ratio.
Table 6. Total time devoted to performing different behaviours during 8 h of observation for weaned Holstein heifers (n = 15 per treatment) fed diets with different forage to concentrate ratio.
Data availability statement
The data that support the findings of this study are available from the corresponding author, [F. Hashemzadeh], upon reasonable request.