
Figures & data
Figure 1. Workflow overview of the experimental setup for on farm data collection to unsupervised ML algorithm (k-means) analysis to cluster Simmental cows according to rumination time (RT) recorded in the first week after parturition (from 1 to 7 d) by Hr-Tags rumination loggers (Hr-LD; SCR by Allflex).
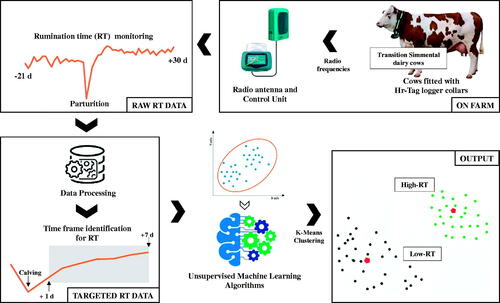
Table 1. Ingredient and nutrient composition of close-up (from −21 to parturition) and early lactation (from parturition to 30 d of lactation) diets fed to Simmental dairy cows.
Figure 2. Daily pattern of rumination time (LSM) from −30 to 30 d from parturition in Simmental primiparous and multiparous dairy cows categorised by k-means clustering analysis according to rumination time (RT) recorded between 1 and 7 d after parturition. Asterisks (*) represent differences at p ≤ 0.05 between High-RT and Low-RT cows within each time point across the transition period (−21 to 30 d relative to calving).
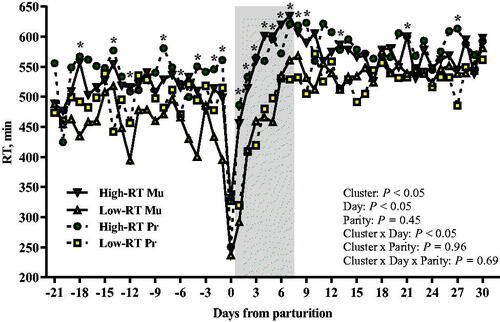
Figure 3. Milk yield in the first 42 d of lactation of Simmental primiparous (High-RT Pr and Low-RT Pr) and multiparous (High-RT Mu and Low-RT Mu) dairy cows categorised by k-means clustering analysis according to rumination time (RT) recorded between 1 and 7 d after calving.
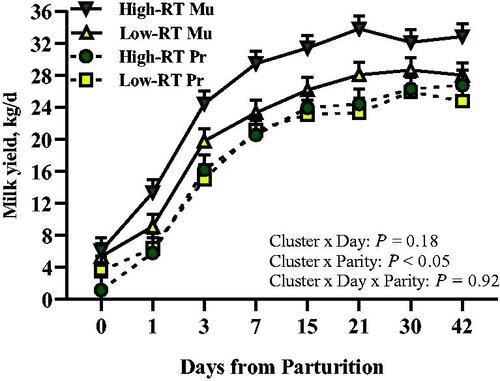
Table 2. LSM of Milk yield (0 to 42 d) and quality (7 to 42 d) from Simmental primiparous (n = 10) and multiparous (n = 15) dairy cows categorised by k-means clustering analysis (unsupervised ML algorithm) according to rumination time (RT) between 1 and 7 d after parturition.
Figure 4. Effect of Cluster (High-RT vs Low-RT) on milk fat percentage (A), and effect of Cluster × Parity × Day on milk BHB (B) in the first 42 d of lactation of Simmental primiparous (High-RT Pr and Low-RT Pr) and multiparous (High-RT Mu and Low-RT Mu) dairy cows categorised by k-means clustering analysis according to rumination time (RT) recorded between 1 and 7 d after calving. Asterisks (*) represent differences at p ≤ 0.05 between High-RT and Low-RT cows within each time point. Different letters (a–c) indicate significant differences among groups within each time point (p ≤ 0.05).
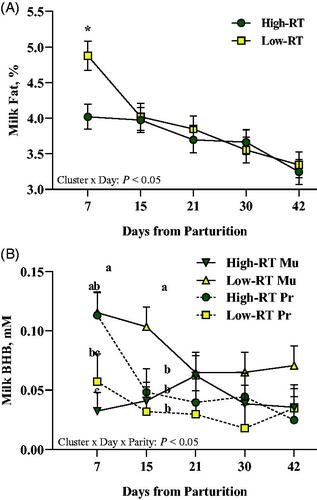
Figure 5. Effect of Cluster (High-RT vs Low-RT) on plasma haptglobin (A), bilirubin (B), and creatinine (C) across the transition period (from −21 to 28 d relative to parturition) in Simmental dairy cows categorised by k-means clustering analysis according to rumination time (RT) recorded between 1 and 7 d after calving. Asterisks (*) represent differences at p ≤ 0.05 between High-RT and Low-RT cows within each time point.
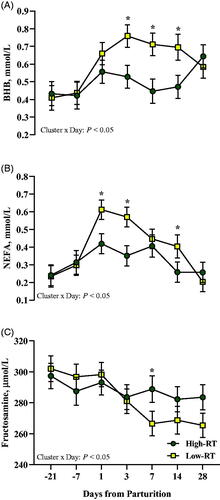
Figure 6. Effect of Cluster (High-RT vs Low-RT) on plasma BHB (A), NEFA (B), and fructosamine (C) across the transition period (from −21 to 28 d relative to parturition) in Simmental dairy cows categorised by k-means clustering analysis according to rumination time (RT) recorded between 1 and 7 d after calving. Asterisks (*) represent differences at P ≤ 0.05 between High-RT and Low-RT cows within each time point.
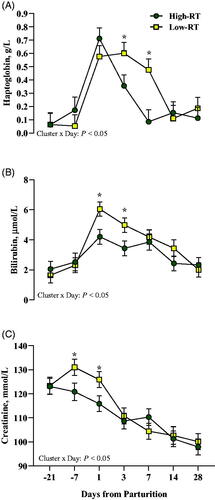
Figure 7. Effect of Cluster (High-RT vs Low-RT) on plasma albumin (A), retinol (B), and tocopherol (C) across the transition period (from −21 to 28 d relative to parturition) in Simmental dairy cows categorised by k-means clustering analysis according to rumination time (RT) recorded between 1 and 7 d after calving. Asterisks (*) represent differences at p ≤ 0.05 between High-RT and Low-RT cows within each time point.
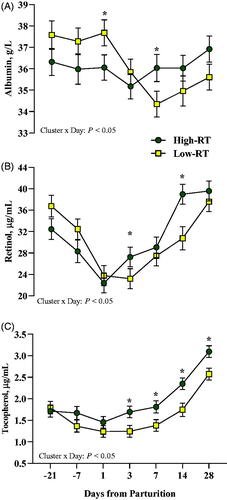
Table 3. Plasma biomarkers (LSM) during the close-up (from −21 d to parturition) and fresh (from 1 to 28 d after calving) periods in Simmental primiparous (n = 10) and multiparous (n = 15) dairy cows categorised by k-means clustering analysis (unsupervised ML algorithm) according to rumination time (RT) between 1 and 7 d after parturition.
Figure 8. Effect of Cluster × Parity × Day on plasma cholesterol (A), total protein (B), and FRAP (C) across the transition period (from −21 to 28 d relative to parturition) in Simmental primiparous (High-RT Pr and Low-RT Pr) and multiparous (High-RT Mu and Low-RT Mu) dairy cows categorised by k-means clustering analysis according to rumination time (RT) recorded between 1 and 7 d after calving. Different letters (a–b) indicate significant differences among groups within each time point (p ≤ 0.05).
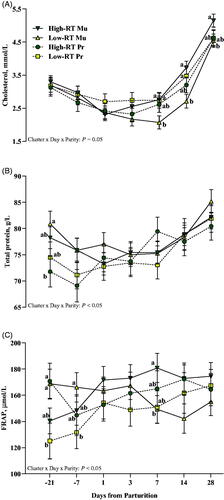
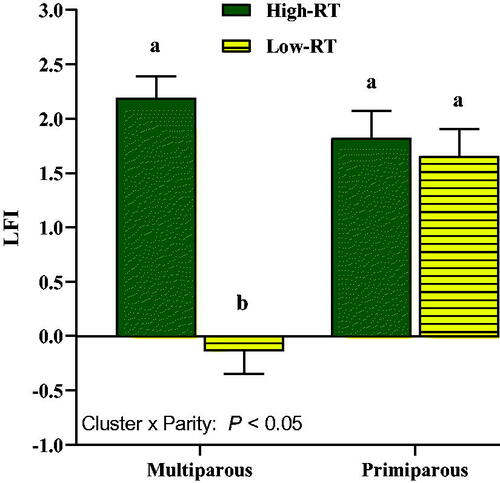
Figure 9. Effect of Cluster × Parity on liver functionality index (LFI) calculated with data obtained at 3 and 28 d after calving for albumin, cholesterol, and bilirubin in Simmental primiparous (High-RT Pr and Low-RT Pr) and multiparous (High-RT Mu and Low-RT Mu) dairy cows categorised by k-means clustering analysis according to rumination time (RT) recorded between 1 and 7 d after calving. Different letters (a–b) indicate significant differences among groups (p ≤ 0.05).
Supplemental Material
Download MS Word (121.4 KB)Data availability statement
Data available on request from the authors.