
Figures & data
Figure 1. Sample distribution. P25: value at 25% of observations; P50: value at 50% of observations and P75: value at 75% of observations.
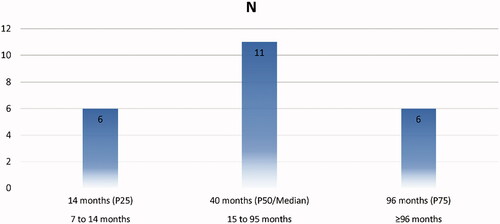
Table 1. Models and model syntax.
Table 2. Summary of the results for determination coefficients, curve shape parameters, and peak for best fitting models for all the variables in the study.
Table 3. Summary of the measures for model fitness and flexibility criteria of the best fitting linear or nonlinear regression models for each particular trait.
Table 4. Mean and Standard Deviation for Testicular biometric parameters in juvenile foal and mature Miranda donkeys.
Figure 2. Body weight (BW) modelling using a sigmoid curve function.
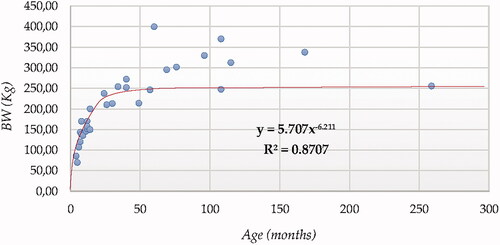
Figure 3. Left Testicle Length in cm modelling using a cubic function.
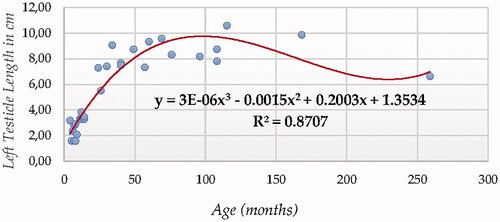
Figure 4. Right Testicle Length in cm modelling using a cubic function.
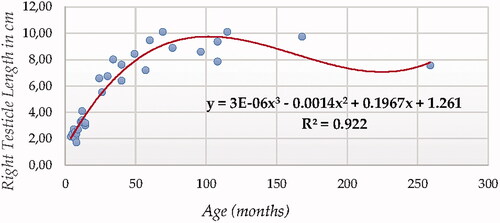
Figure 5. Left Testicle Height in cm modelling using a cubic function.
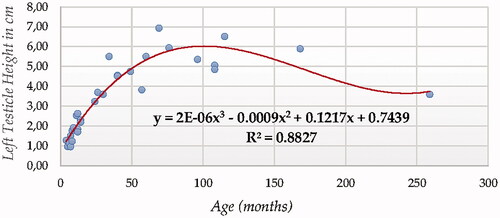
Figure 6. Right Testicle Height in cm modelling using a cubic function.
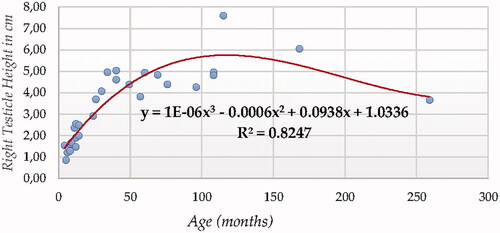
Figure 7. Left Testicle Width in cm modelling using a cubic function.
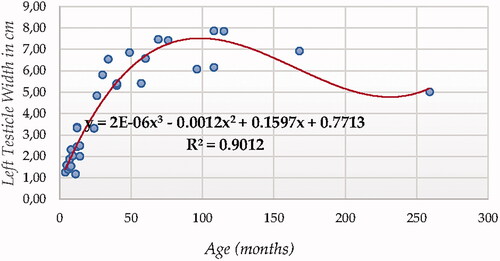
Figure 8. Right Testicle Width in cm modelling using a cubic function.
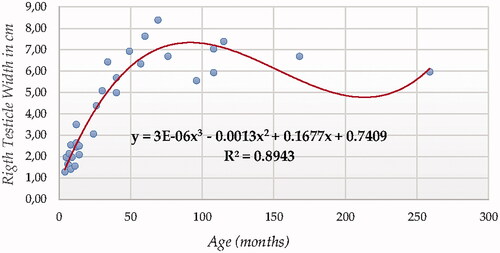
Figure 9. Left Testicle Volume in cm3 modelling using a cubic function.
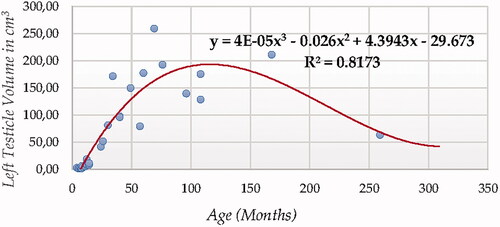
Figure 10. Right Testicle Volume in cm3 modelling using a cubic function.
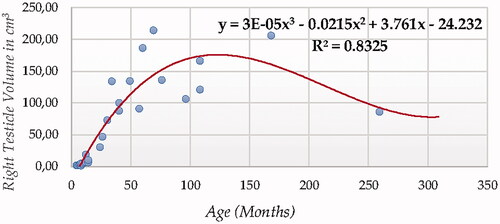
Figure 11. Total Testicle Volume in cm3 modelling using a cubic function.
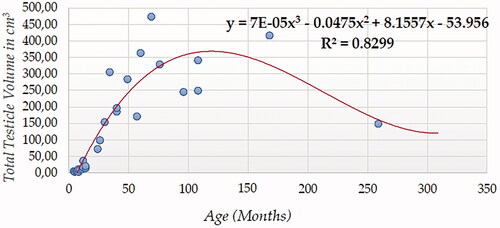
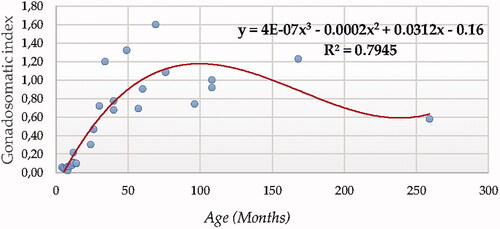
Figure 12. Gonadosomatic index (GSI) modelling using a cubic function.
Supplemental Material
Download MS Word (35.2 KB)Supplemental Material
Download MS Word (49.7 KB)Supplemental Material
Download MS Word (16.7 KB)Supplemental Material
Download MS Word (18.7 KB)Supplemental Material
Download MS Word (14.5 KB)Data availability statement
Data will be made available from the corresponding authors F.J.N.G. and A.M.B. upon reasonable request.