
Figures & data
Table 1. Parameters taken from each TRACES and criteria to define their compliance with the regulation and data plausibility.
Figure 1. Frequency distribution of TRACES and the total number of animals in 2019 and 2020.
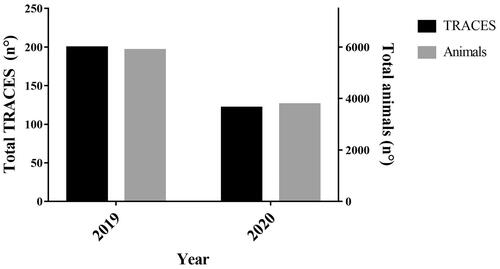
Figure 2. Relative frequency distribution of TRACES (panel a) and the total number of animals (panel b) during 2019 and 2020 according to the country of destination. The differences were not significant.
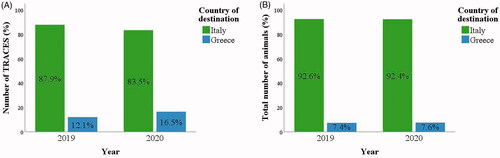
Table 2. Descriptive statistics and results of the goodness of fit test for some generic information reported in Part I.
Table 3. Descriptive statistics of parameters related to loading density as reported on the TRACES’ planning or computed ‘a posteriori’.
Table 4. Classification of animals in weight categories (as computed by dividing the total weight by the number of animals), errors concerning the total number of animals, total weight and/or total space, and compliance of the estimated load density with the Regulation (EC) no. 1/2005.
Table 5. Factors associated with the presence of at least one error related to total number of animals, total weight, and/or total space, regulatory compliance for foreseen restings, and concordance between declared and estimated duration.
Table 6. Descriptive statistics of parameters related to foreseen resting stops as reported on the planning or estimated, and regulatory compliance.
Figure 3. Distribution of the comparison between the estimated journey time reported in each examined TRACES and those calculated according to journey length (at an average speed of 70 km/h), including 1 h for loading/unloading practices and duration of compulsory resting stops.
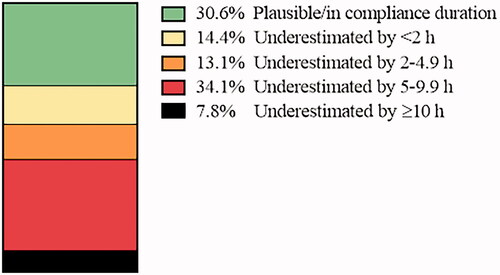
Table 7. Descriptive statistics for the duration of the journey as reported in the examined TRACES and as calculated based on the kilometres travelled and the compulsory resting stops.