
Figures & data
Figure 1. Photo of a Sicilian family with their 4-month-old Mannara dog wearing the typical spiked leather collar (Palermo, 1968).
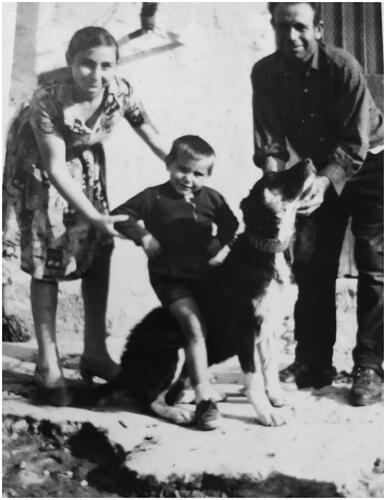
Figure 2. Annual Mannara dog population from 2014, year of the establishment of the studbook (RSA), to present. Green = founders enrolled in the RSA after being phenotypically evaluated by breed expert judges; blue = registered offspring of dogs already in possession of the pedigree.
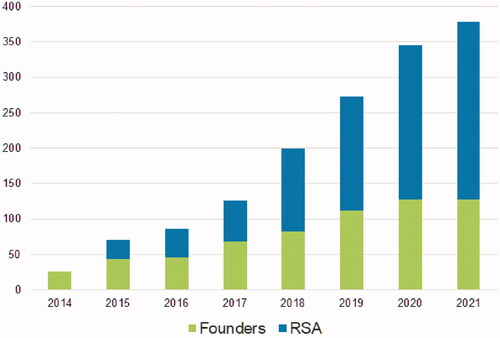
Figure 3. Representation of the ideal Mannara dog, by Paolo Maranto, FCI dog judge and ENCI board member of the SAMANNARA kennel club. The reference points for the body (A) and head (B) measurements taken in the present study are represented.
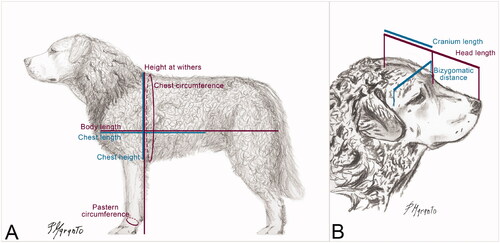
Table 1. Mean ± standard deviation, minimum, and maximum values of the individual somatic measurements and conformation indices for adult male and female Mannara dogs.
Figure 4. Ideal head of Mannara dogs, with the typical ‘cannon’ shape. Photos by courtesy of the breeders.
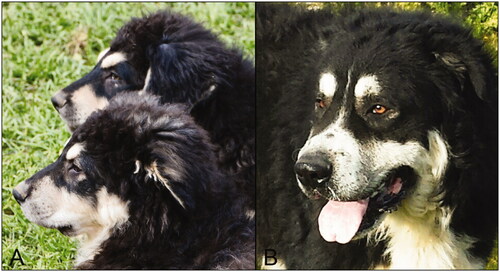
Figure 5. Typical Mannara dogs. (A) Seven-month-old female Mannara dog, with red and white coat. (B) Adult female Mannara dog with brindle tricolour coat. (C) Adult female Mannara dog with black and white (locally called ‘nun’) coat. (D) Seven-month-old male Mannara dog with black and tan coat (locally called ‘four-eyes’). (E) Adult male Mannara dog, with black and white (locally called ‘nun’) coat, while working with a sheep herd. Photos by courtesy of the breeders.
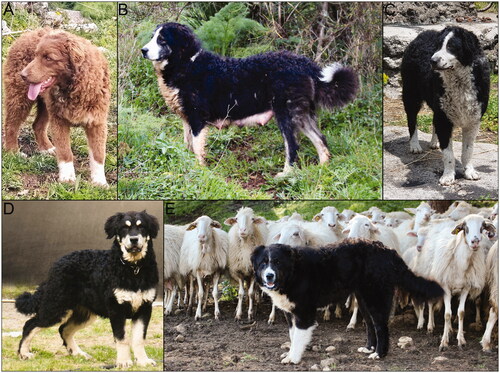
Figure 6. Boxplot representing the age of the parents (males and females) at the moment of the birth of their offspring. The box represents the values from the first to the third quartile; the middle line represents the median and the X the mean; the vertical line extends from the minimum to the maximum value, excluding outliers, which are represented as individual dots.
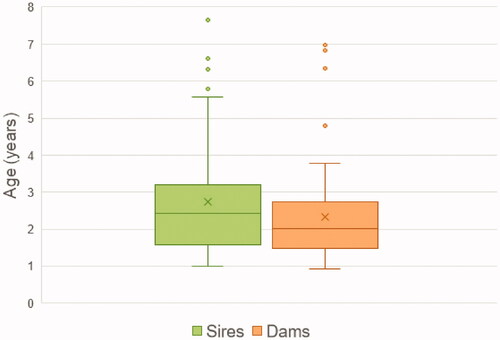
Table 2. Results of Mannara dogs’ pedigrees analyses. Founders were defined as dogs with no pedigree information.
Table 3. Pedigrees’ depth. In fully traced generations, all the ancestors are known; the number of maximum generations traced refers to the ones in which at least one ancestor is known.
Figure 7. Plot of the multidimensional scaling analysis (MDS). Each dot represents a subject and each colour a breed.
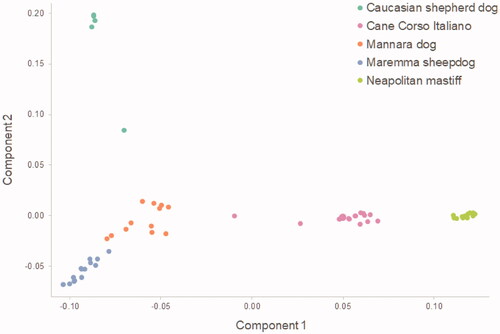
Figure 8. Reynolds distance-based phylogenetic tree. CAUC: Caucasian shepherd dog; MANN: Mannara dog; MARM: Maremma sheepdog; CCIT: Cane Corso Italiano; NEAP: Neapolitan mastiff.
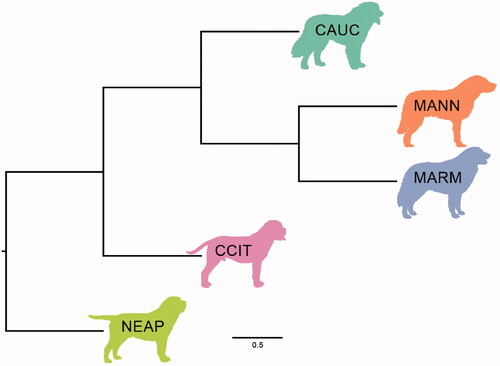
Figure 9. Admixture analysis representation (K = 5). Each cluster is represented by a different colour. CAUC: Caucasian shepherd dog; CCIT: Cane Corso Italiano; MANN: Mannara dog; MARM: Maremma sheepdog; NEAP: Neapolitan mastiff.
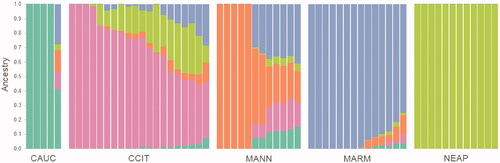
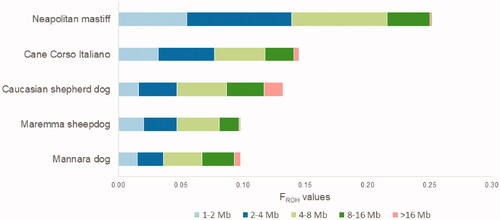
Figure 10. Bar chart representing each breed’s FROH in five different length classes; the longer shorter is the ROH, the older is the inbreeding event that originated it. The sum of each class’s FROH corresponds to the overall FROH of the breed.
Supplemental Material
Download MS Word (495.7 KB)Data availability statement
The authors confirm that the data supporting the findings of this study are available within the article and its supplementary materials.