
Figures & data
Table 1. Composition and nutrient levels of the basal diet (air-dry basis).
Figure 1. Changes of gEGF concentration after digestion with artificial gastric juice and artificial intestinal juice. (a) artificial gastric juice. (b) artificial intestinal juice. values are mean ± SEM. n = 3. a–b–c Means with different superscripts in the same row indicate significantly difference (p < .05). Abbreviations: gEGF: gallus epidermal growth factor; SEM: Standard error of means.
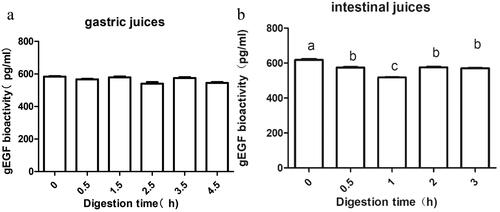
Table 2. Effect of dietary gEGF on the growth performance of broilers.
Table 3. Effect of dietary gEGF on the serum biochemical indices of broilers.
Table 4. Effect of dietary gEGF on serum antioxidant capacity of broilers.
Table 5. Effect of dietary gEGF on the index of immune organs of broilers.
Table 6. Effect of dietary gEGF on serum immunoglobulins of broilers.
Table 7. Effect of dietary gEGF on mucosal morphological traits of small intestine of broilers.
Data availability statement
The authors confirm that the data supporting the findings of this study are available within the article.