
Figures & data
Table 1. Number (frequency between brackets) of herds and cows involved in the study, and number of records (frequency between brackets) within herd and breeds.
Table 2. Number of test day records, mean, standard deviation (SD), range and coefficient of variation (CV) for milk yield, composition, somatic cell score, urea, detailed protein composition and coagulation properties.
Table 3. F-values of fixed effects of breed (B), month of sampling (M), parity order (P), stage of lactation (S) and their first-order interactions and percentage of total variance explained by random effects of herd, cow nested within breed and residual for milk yield, composition, somatic cell score, urea, detailed protein composition and coagulation properties.
Table 4. Least squares means (standard error) of milk yield, composition, somatic cell score, urea, detailed protein composition and coagulation properties.
Figure 1. Least squares mean of (A) α-casein (α-CN), (B) β-casein (β-CN), (C) κ-casein (κ-CN), (D) β-lactoglobulin (β-LG) and (E) α-lactalbumin (α-LA) across stage of lactation for Brown Swiss (![]()
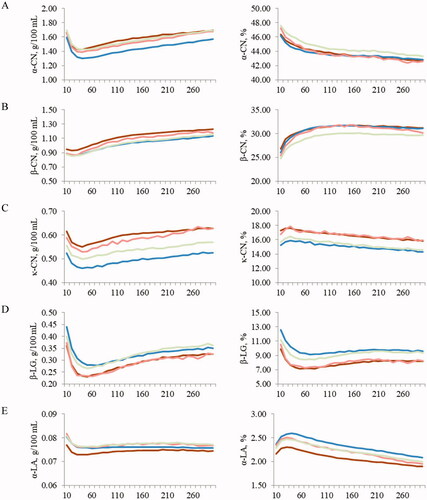
Figure 2. Least squares mean of (A) α-casein (α-CN), (B) β-casein (β-CN), (C) κ-casein (κ-CN), (D) β-lactoglobulin (β-LG) and (E) α-lactalbumin (α-LA) across parity class for Brown Swiss (![]()
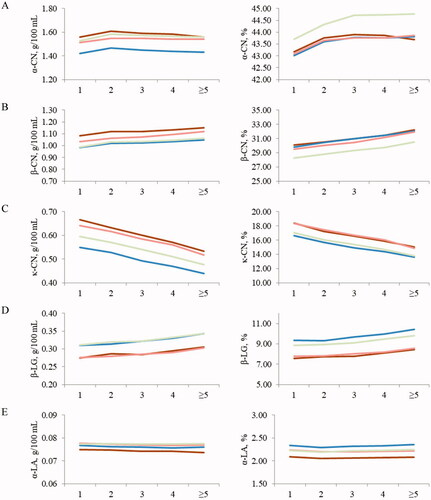
Table 5. Pearson correlation coefficients for protein fractions (measured as % of crude protein) and milk coagulation properties.
Table 6. Results from Lagrange constrained optimisation of protein relative concentration for milk coagulation properties and index of milk aptitude to coagulate.
Data availability statement
None of the data were deposited in an official repository. The data that support the findings presented in this study are available from the first author or corresponding author upon reasonable request.