
Figures & data
Figure 1. Principal component analysis (PCA) score plot of control, stress-control and quality control (QC) samples under the positive ion mode(POS) (A) and negative ion mode(NEG) (B). PCA based on the UHPLC-MS/MS spectra of QC samples and metabolites in serum samples obtained from the stress (DEX-injection) group and control group, A represented stress samples and B represented control samples.
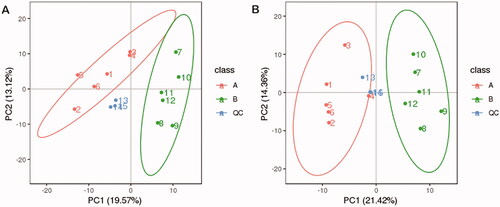
Figure 2. PCA scores of total samples under the positive ion mode (A) and negative ion mode (B), respectively (n = 6). Partial least squares discriminant analysis (PLS‐DA) with a 2 D score plot of stress group and controls under the positive ion mode (C) and negative ion mode (D), respectively. Permutation analysis plotting R2 and Q2 from 200 permutation tests in the PLS-DA model, under the positive ion mode (E) and negative mode (F), respectively. A represented stress samples and B represented control samples.
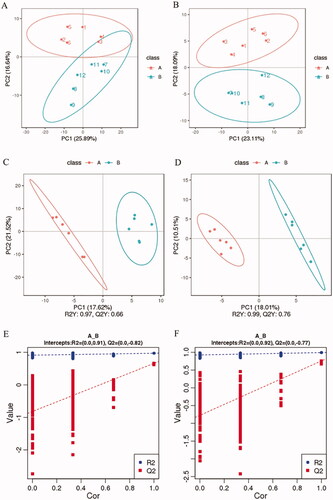
Figure 3. Volcano plot by metabolomics analysis under the positive ion mode (A) and negative ion mode (B), respectively (n = 6). The red points represent significantly up-regulated different metabolites (FC > 1.2, p-value <0.05, and VIP > 1) according to the univariate statistical analysis, the green points indicate metabolites that were significantly down-regulated (FC <0.833, p-value <.05, and VIP > 1).
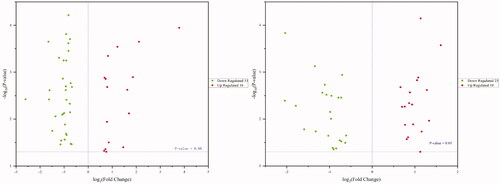
Figure 4. Heat maps of significantly different metabolites in serum of rabbits under the positive ion mode (A) and negative ion mode (B), respectively (n = 6). The colour in the panel represents the relative levels of each metabolite: blue represents low levels, and red represents high levels. In maps, class A represented stress samples and class B represented control samples.
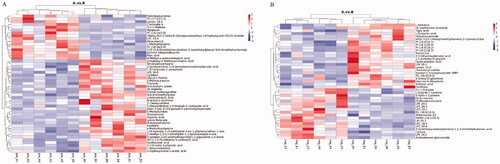
Table 1. Positively identified significantly differentially expressed metabolites in the rabbit serum after chronic dexamethasone (DEX) treatment in under the positive ion mode (n = 6).
Table 2. Positively identified significantly differentially expressed metabolites in the rabbit serum after chronic dexamethasone (DEX) treatment under the negative ion mode (n = 6).
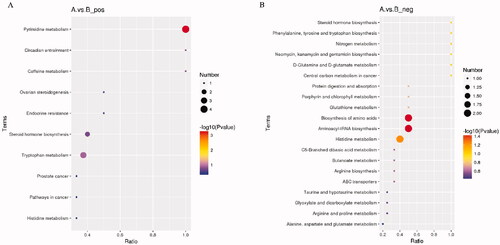
Figure 5. Affected metabolomic pathways of differentially expressed metabolites according to the KEGG database matched results under the positive ion mode (A) and negative ion mode (B), respectively (n = 6). The size of each spot represents the metabolite number, and the colour represents p-value. In maps, class A represented stress samples and class B represented control samples.
Supplemental Material
Download MS Word (14.5 KB)Supplemental Material
Download MS Excel (943 KB)Data availability statement
The data that support the findings of this study are available from the corresponding author upon reasonable request.