
Figures & data
Table 1. Quantitative PCR primer sequences for detecting selected inflammatory cytokines and GAPDH.
Figure 1. Morphological observation of isolated PBMCs and PMNLs from dry cows. (A) PBMCs were mainly lymphocytes (black arrow), with some monocytes (white arrow). (B) PMNLs were mainly neutrophils (white arrow), with some eosinophils (black arrow). PBMCs: Peripheral blood mononuclear cells; PMNLs: Polymorphonuclear leukocytes.
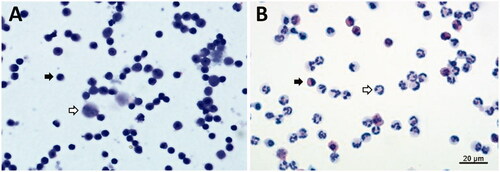
Table 2. Viability of PBMCs and PMNLs under NEFA or BHBA treatment alone and in combination with LPS for 4 h.
Figure 2. Cytokine expression induced by combination treatment of NEFA with LPS in PBMCs and PMNLs. PBMCs and PMNLs were treated with 0.1, 0.6, and 1.5 mM NEFA alone or with 1 µg/mL LPS for 4 h. The mRNA expression levels of TNF-α, IL-1β, IL-6, IL-8, and IL-10 were determined through real-time PCR. Data are presented as means ± SEs. p values represent comparisons between two groups through one-way ANOVA; a p value of <.05 denotes statistical significance. * indicates p < .05, and ** indicates p < .01. NEFA: Nonesterified fatty acids; LPS: Lipopolysaccharides; PBMC(s): Peripheral blood mononuclear cell(s); PMNL(s): Polymorphonuclear leukocyte(s); mRNA: messenger ribonucleic acid; TNF-α: Tumor necrosis factor-α; IL-1β: Interleukin-1β; IL-6: Interleukin-6;IL-8: Interleukin-8; IL-10: Interleukin-10; PCR: Polymerase chain reaction; SEs: Standard errors; One-way ANOVA: One-way analysis of variance.
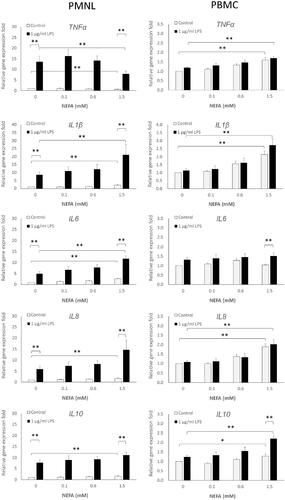
Table 3. Analysis of dose-dependent and combination effects on cytokine expression induced by NEFA alone or in combination with LPS treatment in PMNLs and PBMCs.
Figure 3. Summary of findings suggesting effects of NEFA and LPS on inflammatory cytokine expression in bovine PBMCs and PMNLs. Under NEB, NEFA induces inflammatory cytokine expression, and when combined with exposure to a pathogen (e.g. LPS), the expression levels of these inflammatory cytokines are further increased, resulting in excessive inflammatory response. +, induction by NEFA treatment; ++, synergistic induction by NEFA and LPS combination treatment; –, suppression by NEFA treatment; *, dose-dependent induction by NEFA treatment. Grey font, no significant induction or suppression identified. NEFA: Nonesterified fatty acids; LPS: Lipopolysaccharides; PBMC(s): Peripheral blood mononuclear cell(s); PMNL(s): Polymorphonuclear leukocyte(s); NEB: Negative energy balance; TNF-α: Tumor necrosis factor-α; IL-1β: Interleukin-1β; IL-6: Interleukin-6;IL-8: Interleukin-8; IL-10: Interleukin-10.
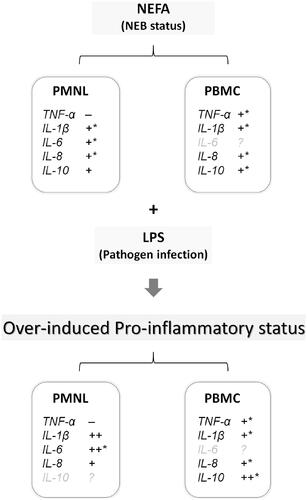
Figure 4. Cytokine expression induced by combination treatment of BHBA with LPS in PBMCs and PMNLs. PBMCs and PMNLs were treated for 4 h with 0, 5, and 10 mM BHBA, either alone or with 1 µg/mL LPS. The mRNA expression levels of TNF-α, IL-1β, IL-6, IL-8, and IL-10 were determined through real-time PCR. Data are presented as the mean ± SE. *, p values represent comparisons between two groups through one-way ANOVA; a value of <.05 denotes statistical significance. * indicates p < .05, and ** indicates p < .01. BHBA: β-hydroxybutyric acid; LPS: Lipopolysaccharides; PBMC(s): Peripheral blood mononuclear cell(s); PMNL(s): Polymorphonuclear leukocyte(s); mRNA: messenger ribonucleic acid; TNF-α: Tumor necrosis factor-α; IL-1β: Interleukin-1β; IL-6: Interleukin-6;IL-8: Interleukin-8; IL-10: Interleukin-10; PCR: Polymerase chain reaction; SEs: Standard errors; One-way ANOVA: One-way analysis of variance.
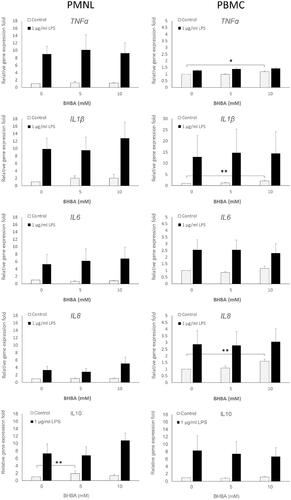
Table 4. Analysis of dose-dependent and combination effects on cytokine expression induced by BHBA alone or in combination with LPS treatment in PMNLs and PBMCs.
Data availability statement
All data presented in this study are available upon request.