Figures & data
Table 1. Chemical composition of red orange and lemon extract (RLE) used in this study.
Figure 1. Effects of the red orange and lemon extract (RLE) on body weight growth in control group and RLE group during 40 days of treatment.
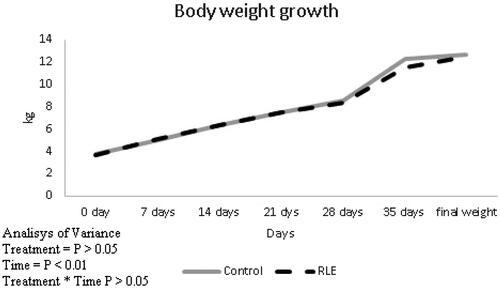
Table 2. Effects of red orange and lemon extract (RLE) on growth performances and carcase weight of kid lamb in control group and RLE group after 40 days of treatment.
Figure 2. Effects of the red orange and lemon extract (RLE on malondialdehyde (MDA), expressed in nmol/dL in control group and RLE group after 40 days of treatment. Data are shown as mean ± standard deviation (DS) and were compared by ANOVA (*p < .05 versus control).
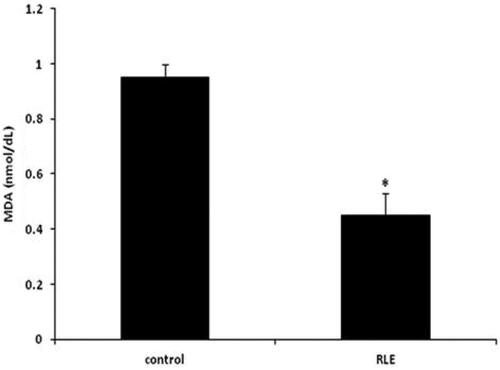
Table 3. Effects of red orange and lemon extract (RLE) on antioxidant status of lamb in control group and RLE group at the end of treatment.
Tabel 4. Effects of orange and lemon extract (RLE) on the antioxidant status of lamb in the control group and in the RLE group in kidney, liver and intestine.
Figure 3. Effects of the red orange and lemon extract (RLE on urinary 8-hydroxy-2’-deoxyguanosine [8-OHdG] concentration, expressed in ug/day in control group and RLE group after 40 days of treatment. Data are shown as mean ± standard deviation (DS) and were compared by ANOVA (*p < .05 versus control).
![Figure 3. Effects of the red orange and lemon extract (RLE on urinary 8-hydroxy-2’-deoxyguanosine [8-OHdG] concentration, expressed in ug/day in control group and RLE group after 40 days of treatment. Data are shown as mean ± standard deviation (DS) and were compared by ANOVA (*p < .05 versus control).](/cms/asset/a84ae28e-1bb1-475b-a259-e4f51fb3ddfb/tjas_a_2056527_f0003_b.jpg)
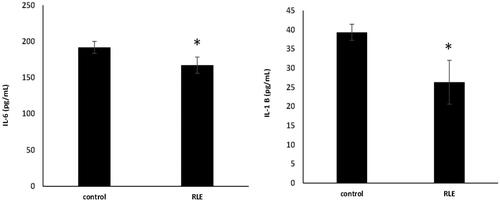
Figure 4. Effects of the red orange and lemon extract (RLE on interleuchin-6 (IL-6) (a) and interleuchin-1 β (IL -1 β) (b) levels, expressed as pg/mL, in control group and RLE group after 40 days of treatment. Data are shown as mean ± standard deviation (DS) and were compared by ANOVA (*p < .05 versus control).