
Figures & data
Figure 1. Cost per megabase of DNA sequenced, in US$. One megabase = one million bases.
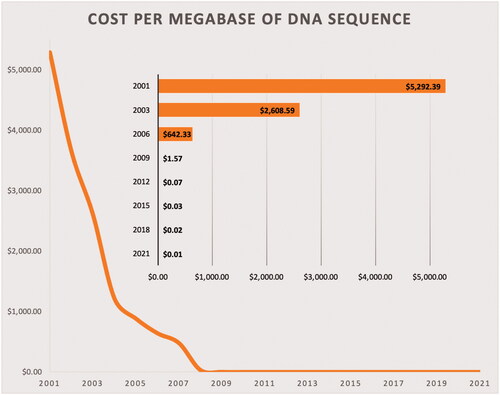
Figure 2. Schematic representation of the 16S rRNA gene depicting the conserved and variable regions and some potential sections of the gene to be amplified by primers.
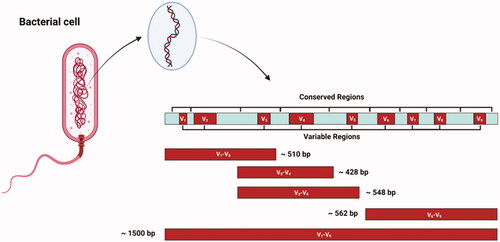
Figure 3. Alpha and beta-diversity of steers finished in feedlot. A) Bray–Curtis dissimilarity observed in the rumen. B) Bray–Curtis dissimilarity observed in the faeces. C) Shannon diversity index observed in the rumen. Weaning = weaning day; Feedlot1 = after adaptation to feedlot diet; Feedlot2 = last week at feedlot; Slaughterhouse = the day steers were killed.
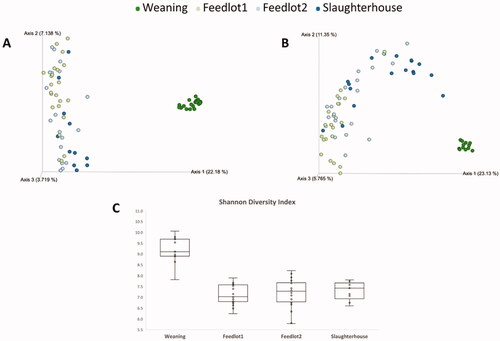
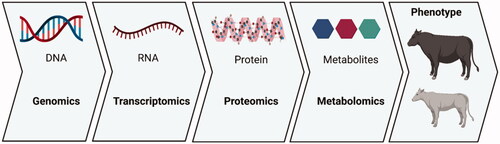
Figure 4. The several layers of biological complexity that can be explored using ‘omics’ approaches.
Data availability statement
The data used to support the findings of this study are available from the corresponding author upon request.