
Figures & data
Figure 1. Size and Shape of silver nano particles.
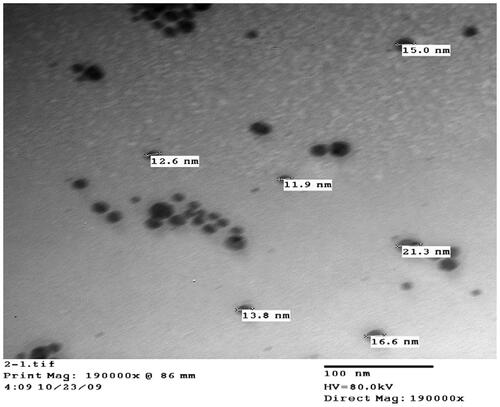
Table 1. Composition and chemical analysis of basal diets (% as fed basis).
Table 2. Effect of different dietary treatments on body weight, feed intake and feed conversion ratio in broiler chickens.
Table 3. Effect of different dietary treatments on carcass traits and relative organ weight and WHC in broiler chickens.
Table 4. The effect of dietary AgNPs level on residues of silver (mg/kg) in meat of broilers.
Table 5. Numbers of dominant bacterial groups in the contents of caeca [log cfu/g] of broilers after treatment with increasing concentration of AgNano.
Table 6. Effect of different dietary treatments on blood metabolites (mg/dL) in broiler chickens.
Figure 2. Representative micrographs for duodenum (A–E) and spleen (F-G) of broiler chickens treated with different levels AgNPs for 42 days, H&E stain. A) Duodenum from control group showing normal epithelium with no lesions. (B) Duodenum from 2.5 mg supplemented group showing normal structure of intestinal villi. (C) Duodenum from 5 mg group showing necrosis and sloughing of epithelium (arrow). (D) Duodenum from 10 mg showing epithelial metaplasia (arrow). (E) Duodenum from 20 mg group showing epithelial metaplasia (arrow). F) Spleen from control group showing normal red and white pulp with normal lymphoid follicle. (G) Spleen from 2.5 mg group showing normal red and white pulp with normal lymphoid follicle. (H) Spleen from 5 mg group showing congestion of the blood vessels, desquamation of endothelium (arrow) and perivascular infiltration. (I) Spleen from 10 mg group showing necrosis of the lymphoid follicle (arrow). (G) Spleen from 20 mg group showing necrosis of the lymphoid follicle (arrow).
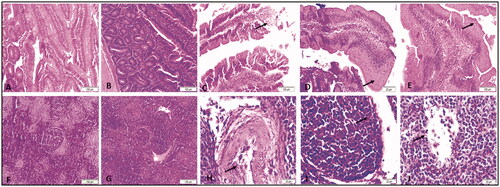
Figure 3. Representative micrographs for liver (A–E) and kidney (F-J) of broiler chickens treated with different levels AgNPs for 42 days, H&E stain. A) Liver from control group showing normal hepatic architecture. (B) Liver from 2.5 mg group showing focal mononuclear infiltration (arrow). (C) Liver from 5 mg group showing congestion and vacuolar degeneration. (D) Liver from 10 mg group showing hepatocellular vacuolation (arrow). (E) Liver from 20 mg group showing hepatocellular vacuolation (arrow). F) Kidney from control group showing normal glomerulus and renal tubules. (G) Kidney from 2.5 mg group showing normal glomerulus and renal tubules. (H) Kidney from 5 mg group showing congestion of the glomerulus (arrow). (I) Kidney from 10 mg group showing severe congestion of the blood vessels (arrow). (J) Kidney from 20 mg group showing congestion of the glomerulus (arrow).
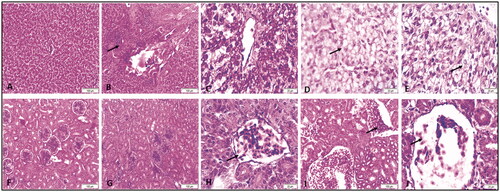
Figure 4. Representative micrographs of Transmission electron microscope of duodenum from broiler chickens treated with 20 mg AgNPs for 42 days showing nano particles of different size inside the nucleus (A) of the enterocyte.
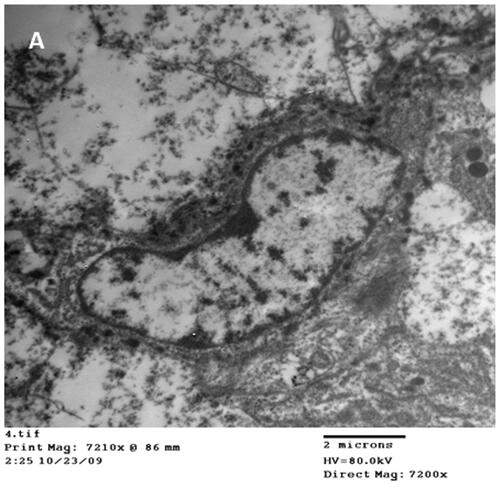
Table 7. Summary of lesion score at 42 days in all studied groups.
Data availability statement
The corresponding author is committed to providing data that support the findings of the study upon request.