
Figures & data
Figure 1. Val Ombretta showing the location of the summer farm, the total grazing area comprising areas used freely by the cows in the afternoon (in blue, ‘Farmer absence’), the sub-areas where the farmer conducted the cows in the morning (in red, ‘Farmer presence’), and the positions of drinking troughs.
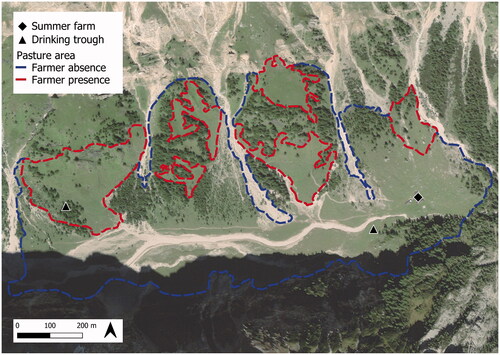
Figure 2. Effects on distance walked daily of Julian date, distance walked in the morning and daily vertical movement (panels A, B, and C, respectively), and effects on daily vertical movement of Julian date, rain occurrence, and temperature class (panels D, E, and F, respectively). Shaded areas indicate 95% confidence intervals. Only significant effects are shown; for details of the parametric coefficients of the statistical models see Supplementary Table S1.
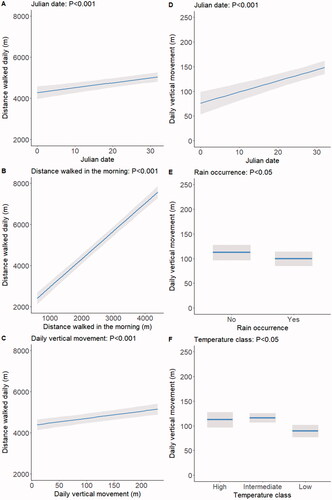
Figure 3. Effects of the smoothed spline of hour, and of the interactions breed by day period, rain occurrence by day period, and temperature class by day period on the slope (panels A, B, C and D, respectively) and on the altitude used (panels E, F, G and H, respectively), and effects of the smoothed spline of hour, breed, rain occurrence and the temperature class by period interaction on speed (panels I, J, H and K, respectively). Shaded areas indicate 95% confidence intervals. The vertical dotted line in panels A, E and I indicate the separation between the morning and afternoon day periods at 12 am. For details of the parametric coefficients of the statistical models see Supplementary Table S2.
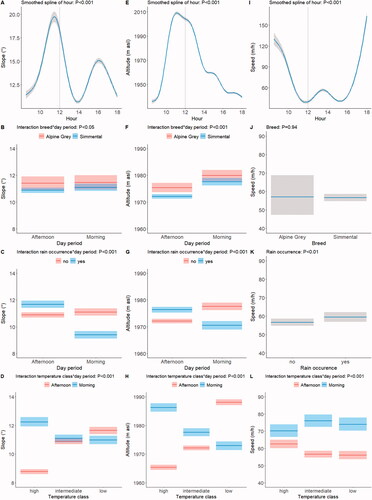
Figure 4. Intensity of use of pasture (no. of locations cumulated over the study period within a 10 × 10 m grid) in the morning (A) and afternoon (B).
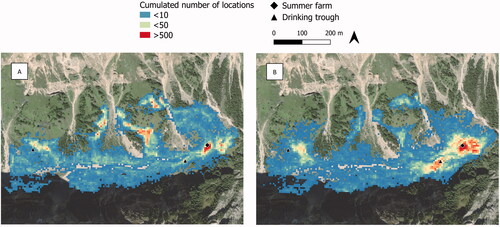
Figure 5. Predicted probability of use of pasture area according to the two-way interactions between day period and NDVI class, slope class and habitat type. Shaded areas indicate 95% confidence intervals.
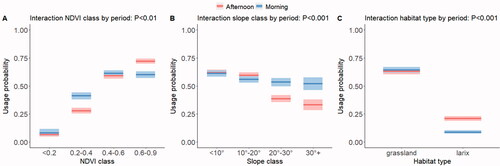
Figure 5. Predicted probability of use of pasture area according to the two-way interactions between day period and NDVI class, slope class and habitat type. Shaded areas indicate 95% confidence intervals
Supplemental Material
Download MS Word (29.9 KB)Data availability statement
The data of this study are freely available from the corresponding author upon request. The data are not publicly available due to the involvement of private partners (farmers).