
Figures & data
Table 1. Nutrient composition and biochemical characteristics of SBM and ESBM.
Table 2. Composition and nutrient levels of the experimental diets (air-dry basis).
Table 3. Effect of enzymolytic soybean meal on the antioxidant capacity of Rex rabbits (n = 6).
Table 4. Effect of enzymolytic soybean meal on the intestinal morphology of Rex rabbits (n = 6).
Table 5. Effect of enzymolytic soybean meal on the intestinal pH of Rex rabbits (n = 6).
Figure 1. Rarefaction curves of samples. The Illumina NovaSeq PE250 sequencing platform was used to detect the V3-V4 region of 16S rDNA in the caecum content samples of Rex rabbits. The sequences were selected randomly, the number of species they represented was counted and the dilution curves were plotted by the number of selected sequences and corresponding species. T1 means 0.5% enzymolytic soybean meal addition group, T2 means 1.0% enzymolytic soybean meal addition group, and T3 means 1.5% enzymolytic soybean meal addition group.
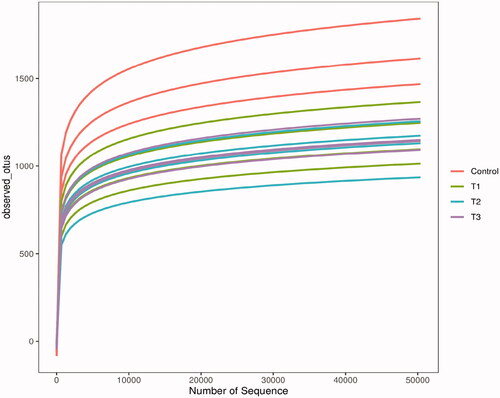
Figure 2. Venn diagram of feature. According to the feature abundance table, the number of features in each group was calculated, and the number of common and unique features in each group was visualised by Venn diagram, if the feature existed in only one group, it was unique to that group. T1 means 0.5% enzymolytic soybean meal addition group, T2 means 1.0% enzymolytic soybean meal addition group, and T3 means 1.5% enzymolytic soybean meal addition group.
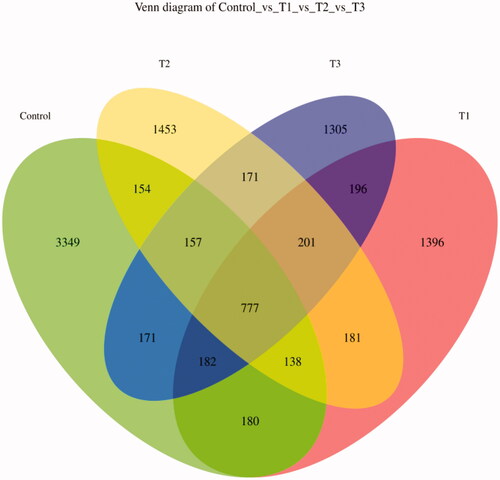
Table 6. Alpha diversity indices of caecal microbiota (n = 4).
Figure 3. Principal co-ordinates analysis diagram of caecal microflora composition. Principal Coordinate Analysis (PCoA) is based on a sample distance matrix for ranking. The PCoA analysis allows the difference among the groups to be observed. The different colours in the results represent the different groupings and the closer the distance, the more similar the structure of the microbial composition and the less difference. T1 means 0.5% enzymolytic soybean meal addition group, T2 means 1.0% enzymolytic soybean meal addition group, and T3 means 1.5% enzymolytic soybean meal addition group.
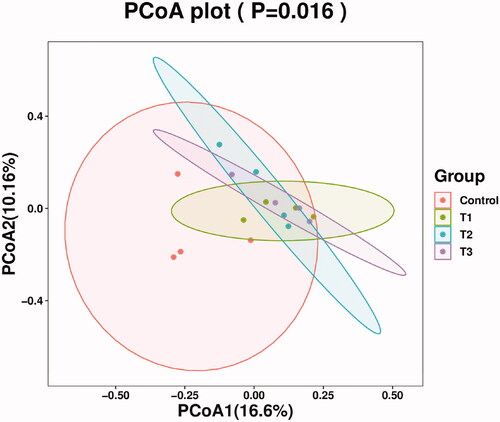
Figure 4. Relative abundance of caecal microbiota at phylum level. T1 means 0.5% enzymolytic soybean meal addition group, T2 means 1.0% enzymolytic soybean meal addition group, and T3 means 1.5% enzymolytic soybean meal addition group.
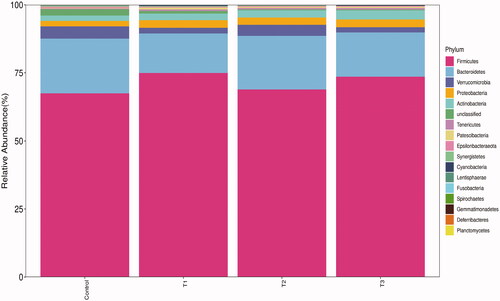
Table 7. Distribution of caecal microbiota at phylum level (%) (n = 4).
Figure 5. Relative abundance of caecal microbiota at genus level. T1 means 0.5% enzymolytic soybean meal addition group, T2 means 1.0% enzymolytic soybean meal addition group, and T3 means 1.5% enzymolytic soybean meal addition group.
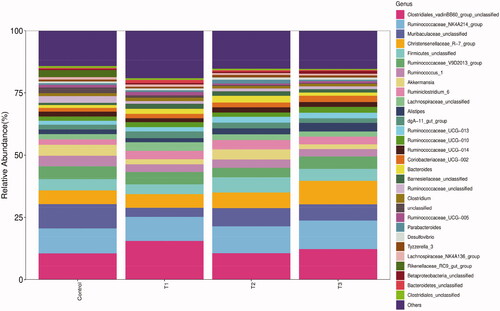
Table 8. Distribution of caecal microbiota at genus level (%) (n = 4).
Data availability statement
The data that support the findings of this study are available from the corresponding author upon reasonable request.