Figures & data
Table 1. Composition and nutrient levels of experimental diets (% as fed-basis)*.
Table 2. Effects of low metabolic energy (LME) diet and high metabolic energy (HME) diet on growth performance in Yellow-feathered chickens from 90 to 135 days of age.
Table 3. Effects of low metabolic energy (LME) diet and high metabolic energy (HME) diet on lipid metabolism indices and the relative weight of liver in Yellow-feathered chickens.
Figure 1. (a) Volcano map. The red dots represent upregulated (P < 0.05) differentially expressed genes (DEG), the blue dots represent downregulated (P < 0.05) DEG, and the gray dots represent insignificant genes in the liver between chickens fed low metabolic energy (LME) and high metabolic energy (HME) diets. (b) Hierarchical clustering. Cluster analyses were performed based on 480 known DEG in the liver between chickens fed LME and HME diets, the LME diet and HME diet were clustered, respectively. Up-regulated DEG are in red and down-regulated DEG are in green.
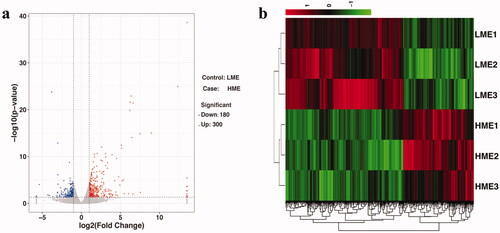
Table 4. Lipid metabolism-related biological processes and cellular component identified by Gene Ontology (GO) analysis of differentially expressed genes between chickens fed low metabolic energy (LME) and high metabolic energy (HME) diets.
Figure 2. KEGG pathway analyses of differentially expressed genes (DEG) in the liver between chickens fed LME and HME diets. The x-axis represents the rich factor, the y-axis represents the enriched pathway. The size of the bubble indicates the number of DEG enriched in the pathway, and the different colours represent enrichment significance, the red colour means the enrichment result is significant.
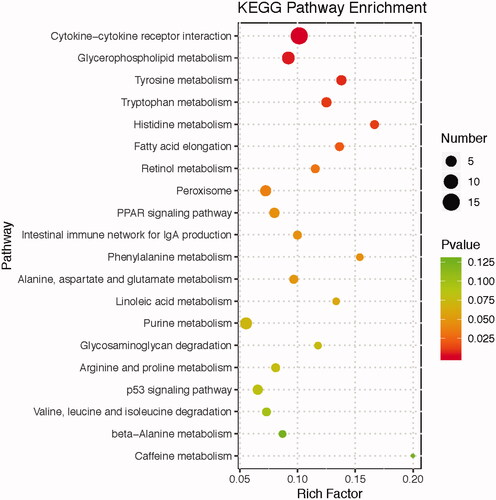
Table 5. The differentially expressed genes involved in five key KEGG pathways between chickens fed low metabolic energy (LME) and high metabolic energy (HME) diets.
Figure 3. Validation of RNA-seq data by q-PCR analyses. ** indicate significance at P < 0.01. MBOAT2: membrane bound O-acyltransferase domain containing 2; PLA2G2E: phospholipase A2 group IIE; AGPAT2: 1-acylglycerol-3-phosphate O-acyltransferase 2; AGPAT3: 1-acylglycerol-3-phosphate O-acyltransferase 3; PCYT2: phosphate cytidylyltransferase 2; PEMT: phosphatidylethanolamine N-methyltransferase; ELOVL2: fatty acid elongase 2; HADHA: hydroxyacyl-CoA dehydrogenase trifunctional multienzyme complex subunit alpha; ACOT1L: acyl-CoA thioesterase 1-like; FABP3: fatty acid binding protein 3; FABP1: fatty acid binding protein 1; PLIN1: perilipin 1; RXRG: retinoid X receptor gamma; LCAT: lecithin-cholesterol acyltransferase.
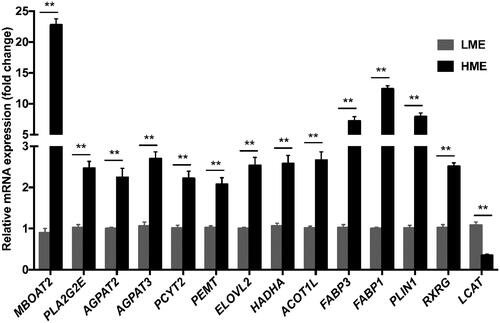
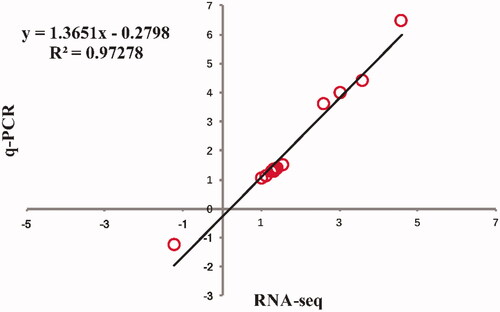
Figure 4. Correlation analysis of the relative expression levels for Log2 Fold Change (FC) of 14 DEG between the RNA-seq and q-PCR.