Figures & data
Table 1. Ingredient and nutrient levels of the basal diets (fed basis).
Table 2. Sequences used for real-time PCR primers.
Table 3. Effects of dietary rutin on growth performance of broilers.
Table 4. Effects of dietary rutin on serum GH/IGF-1 concentration of broilers (day 42).
Table 5. Effects of dietary rutin on jejunal tissue morphology of broilers (day 42).
Figure 1. Effects of dietary rutin on the tight junctions (TJs) of the jejunal mucosa of 42-day-old broilers (representative images of jejunum using transmission electron microscopy). Note: red arrows, the TJs; A, control group, basal diet supplemented 0 mg rutin/kg; B, 500 mg rutin/kg group, basal diet supplemented 500 mg rutin/kg; Scale bar, 1.0 μm.
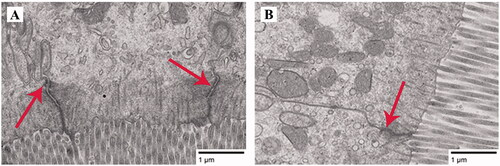
Figure 2. Effects of dietary rutin on the mRNA expressions of proliferation and apoptosis related genes in jejunum mucosa. Note: a, b a, ba,b a, ba,b Means within the same gene of the histogram with different superscript differ significantly (P < 0.05). BAX, B-cell lymphoma 2 associated X; Bcl-2, B-cell lymphoma 2. 0, basal diet (control group); 250, 500 and 1,000, basal diet further supplemented with 250, 500 and 1,000 mg rutin/kg, respectively. Q and L are the quadratic and linear responses, respectively, to the levels of dietary supplementation with rutin.
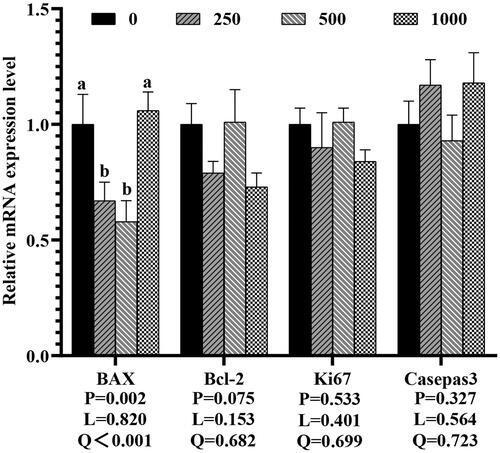
Table 6. Effects of dietary rutin on immune organ indexes and serum immunoglobulin and inflammatory factors of broilers (day 42).
Figure 3. Effects of dietary rutin on the mRNA expressions of immune-related genes in jejunal mucosa of 42-day-old broilers. Note: a, bMeans within the same gene of the histogram with different superscript differ significantly (P < 0.05). NF-κB, nuclear factor kappa-B; MyD88, myeloid differentiation factor 88; IL-2, interferon-2; IFN-γ, interferon -γ; TNF-α, tumor necrosis factor-α. 0, basal diet (control group); 250, 500 and 1,000, basal diet further supplemented with 250, 500 and 1,000 mg rutin/kg, respectively. Q and L are the quadratic and linear responses, respectively, to the levels of dietary supplementation with rutin.
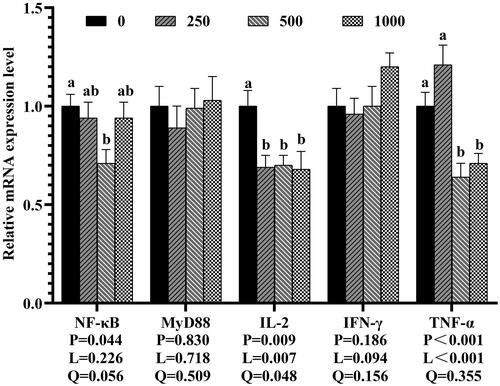
Table 7. Effects of dietary rutin on serum intestinal barrier indicators of broilers (day 42).
Figure 4. Effects of dietary rutin on the mRNA expressions of intestinal barrier-related genes in jejunal mucosa of 42-day-old broilers. Note: a, bmeans within the same gene of the histogram with different superscript differ significantly (P < 0.05). MUC2, mucin2; OCLN, occludin; CLDN2, claudin-2; ZO-1, zonula occludens-1; 0, basal diet (control group); 250, 500 and 1,000, basal diet further supplemented with 250, 500 and 1,000 mg rutin/kg, respectively. Q and L are the quadratic and linear responses, respectively, to the levels of dietary supplementation with rutin.
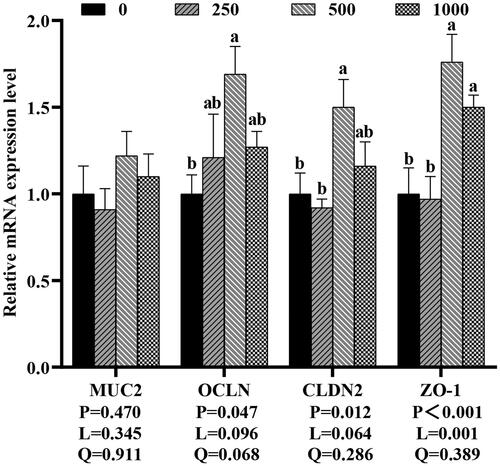
Table 8. Effects of dietary rutin on antioxidant capacity of jejunal mucosa of broilers (day 42).
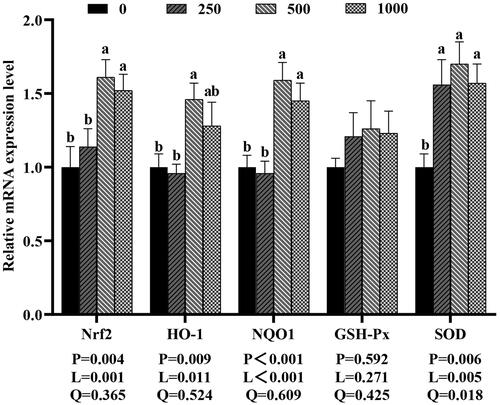
Figure 5. Effects of dietary rutin on the mRNA expressions of antioxidant-related genes in jejunal mucosa of 42-day-old broilers. Note: a, b means within the same gene of the histogram with different superscript differ significantly (P < 0.05). Nrf2, nuclear factor erythroid-2-related factor 2; HO-1, heme oxygenase-1; NQO1, NAD(P)H quinone oxidoreductase 1; GSH-Px, glutathione peroxidase; SOD, superoxide dismutase. 0, basal diet (control group); 250, 500 and 1,000, basal diet further supplemented with 250, 500 and 1,000 mg rutin/kg, respectively. Q and L are the quadratic and linear responses, respectively, to the levels of dietary supplementation with rutin.