
Figures & data
Figure 1. GC-mass chromatogram of paulownia leaf extract (PLE) (above) and standard main bioactive compounds (below).
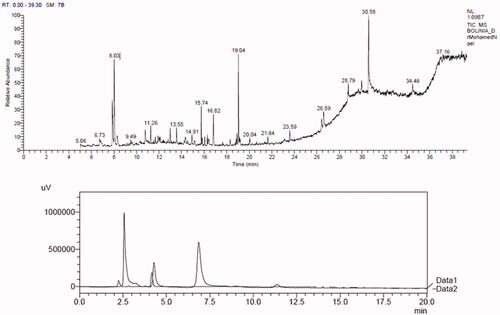
Table 1. The gas chromatography/mass spectrometry analysis and quantitative profile of the main detectable bioactive compounds found in paulownia leaf extract (PLE).
Table 2. Diet formulation and chemical analysis.
Table 3. The effects of paulownia leaf extract (PLE) supplemented diets at different levels (0.0, 0.1, 0.3 and 0.5 g kg−1) on broiler carcase characteristics (n = 5).
Table 4. The effects of paulownia leaf extract (PLE) supplemented diets at different levels (0.0, 0.1, 0.3 and 0.5 g kg−1) on broiler breast and thigh meat quality indices (n = 5) and proximate composition (n = 3).
Table 5. The effects of paulownia leaf extract (PLE) supplemented diets at different levels (0.0, 0.1, 0.3 and 0.5 g kg−1) on broiler sensory attributes indices and pH24 (n = 20).
Table 6. The effects of paulownia leaf extract (PLE) supplemented diets at different levels (0.0, 0.1, 0.3 and 0.5 g kg−1) on economic return and total production revenue.
Data availability statement
The datasets presented and/or applied during the current study are available from the corresponding author on reasonable request.