
Figures & data
Figure 1. Number of herds, cows and spectra collected by breed, herd intensiveness level class (HL) and cow production level class (CL). Five classes of daily milk energy output (dMEO, MJ/d) for each factor: HL-1 and CL-A <-1.5σ; HL-2 and CL-B -1.5σ to -0.5σ; HL-3 and CL-C -0.5σ to +0.5σ; HL-4 and CL-D + 0.5σ to +1.5σ; HL-5 and CL-E > +1.5σ.
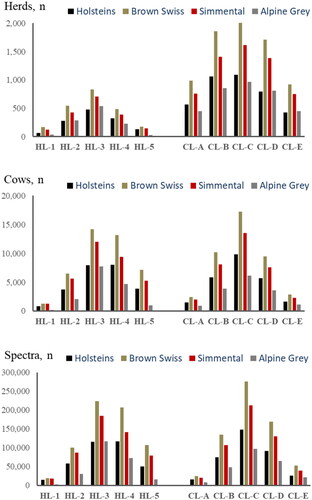
Table 1. Analysis of variance of milk yield and of the predicted informative fatty acids content: F-values of the factors included in the model of analysis (all the effects are highly significant for p < 0.001).
Table 2. Analysis of variance of the enteric CH4 yield, intensity and production predicted directly from milk FTIR spectra or through prediction of informative fatty acids: F-values of the factors included in the model of analysis (all the effects are highly significant for p < 0.001).
Figure 2. Average daily milk production by breed of cows (kg/d).
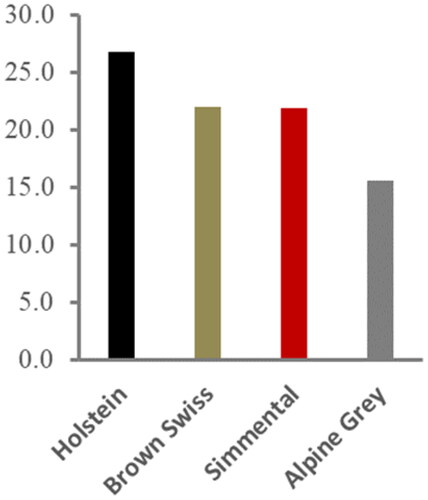
Figure 3. Milk fat, butyric acid (4:0) and iso-palmitic acid (16:0 iso), in % of total fatty acids (LSM ± CI), by breed, herd intensiveness class level or cow production class level plotted against actual cow yield (kg/d).
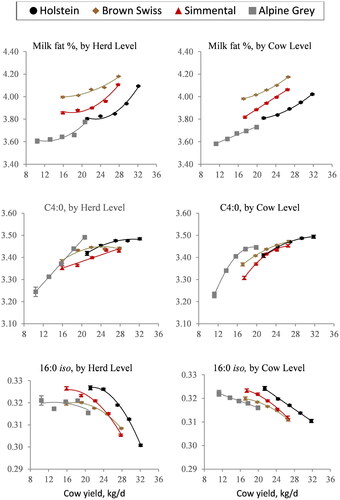
Figure 4. Milk isooleic acid (18:1 trans10), vaccenic (18:1 trans11), oleic (18:1 cis9), and linoleic acid (18:2 cis9,cis12), in % of total fatty acids (LSM ± CI), by breed, herd intensiveness class level or cow production class level plotted against actual cow yield (kg/d).
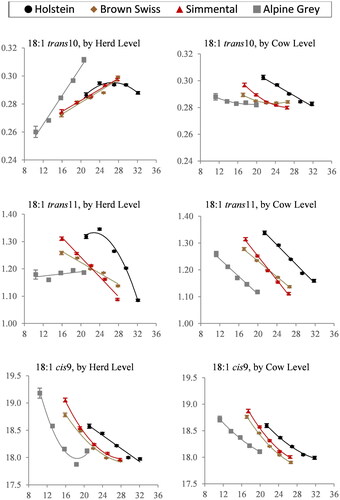
Figure 5. Predicted enteric CH4 yield (LSM ± CI, CH4/DMI, g/kg dry matter intake) predicted directly from milk FTIR spectra or indirectly from predictive informative milk fatty acids by breed, herd intensiveness class level or cow production class level plotted against actual cow yield (kg/d).
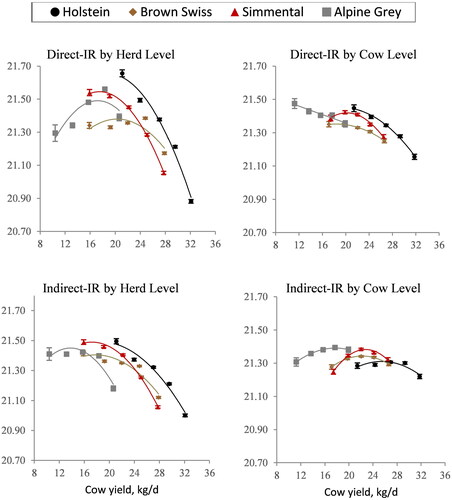
Figure 6. Predicted enteric CH4 intensity (LSM ± CI, g/kg of corrected milk) predicted directly from milk FTIR spectra or indirectly from predictive informative milk fatty acids by breed, herd intensiveness class level or cow production class level plotted against actual cow yield (kg/d).
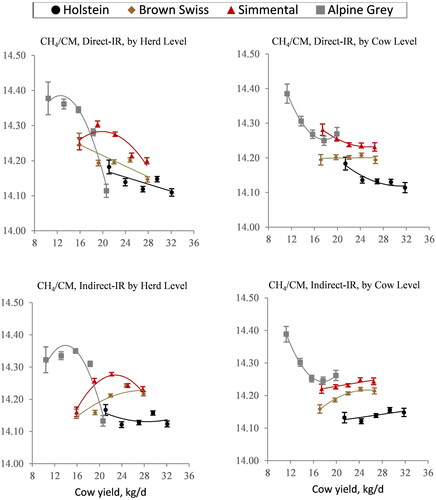
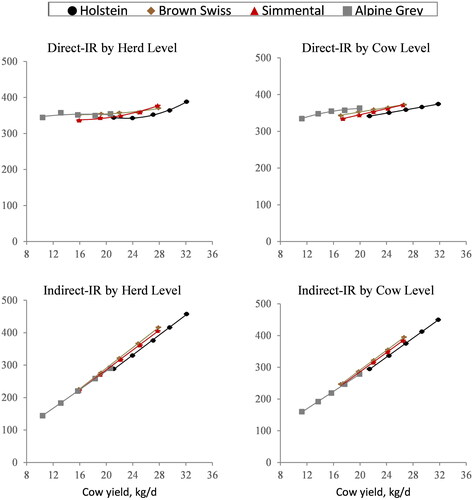
Figure 7. Predicted daily enteric CH4 production (LSM ± CI, dCH4, g/d) predicted directly from milk FTIR spectra or indirectly from predictive informative milk fatty acids by breed, herd intensiveness class level or cow production class level plotted against actual cow yield (kg/d).
Data availability statement
The results and analyses presented in this paper freely available upon request.