
Figures & data
Table 1. Genome Wide Association Study (GWAS) results: SNPs over the Bonferroni (bold) and False Discovery Rate (FDR) genome wide thresholds (0.05 significance value) together with candidate genes.
Figure 1. Experimental design scheme: Susceptible (S1 and S2) and Resistant (R1 and R2) cows in a Selective genotyping and pooling approach.
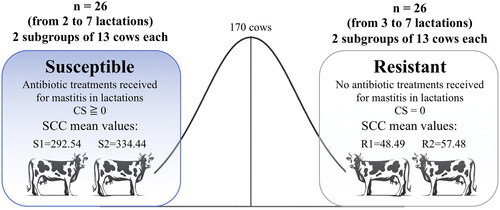
Figure 2. Graphical representation (Manhattan plot) of Genome Wide Association Study (GWAS) results. Horizontal lines represent the Bonferroni (red line) and the False Discovery Rate (FDR) (blue line) genome wide thresholds, both set at 0.05 significance value.
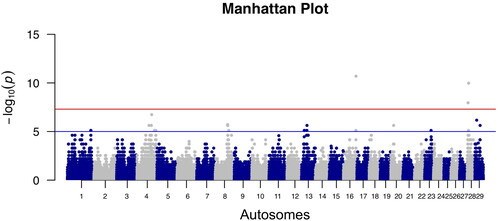
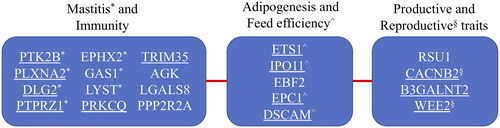
Figure 3. Scheme of gene functions: underlined genes were those in which significant SNPs mapped (intragenic SNPs – all in intronic positions); the others were nearby-genes (Table ).
Supplemental Material
Download MS Word (17.9 KB)Supplemental Material
Download MS Excel (23.4 KB)Supplemental Material
Download MS Word (22.1 KB)Data availability statement
The data are still under embargo as part of a project still active.