
Figures & data
Table 1. Diets offered to the cows during the study.
Figure 1. Values of body condition score (BCS; a) and milk yield (b) from −21 to 28 d from calving (DFC) in Holstein (HOL), Brown Swiss (BRO), and Simmental (SIM) dairy cows managed identically. Br is the breed effect, Time is the time effect, and Br × Time is the interaction effect (superscript letters denote differences for p < .05 at each time point in pairwise comparisons). Time points consider single days for BCS and weekly averages for milk yield.
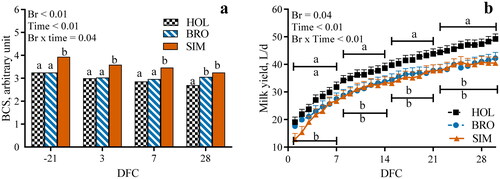
Table 2. Plasma concentrations from −21 to 28 d from calving of biomarkers of metabolism, minerals, liver function, inflammation, and oxidative status in Holstein (HOL), Brown Swiss (BRO), and Simmental (SIM) dairy cows managed identically.
Figure 2. Trends from −21 to 28 d from calving (DFC) of plasma concentrations of P (a), bilirubin (b), glutamate-oxalacetate transaminase (AST-GOT) (c), ceruloplasmin (d), paraoxonase (e), and reactive oxygen metabolites (f) in Holstein (HOL), Brown Swiss (BRO), and Simmental (SIM) dairy cows managed identically. Br is the breed effect, Time is the time effect, and Br × Time is the interaction effect (superscript letters denote differences for p < .05 at each time point in pairwise comparisons).
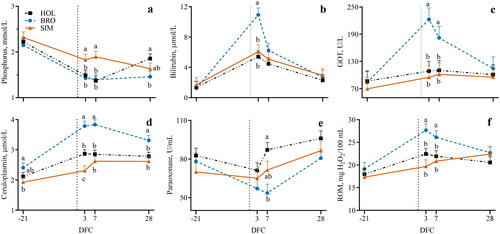
Table 3. Fold changes of cytokines following a whole blood stimulation assay from blood collected 3 d after calving in Holstein (HOL), Brown Swiss (BRO), and Simmental (SIM) dairy cows managed identically.
Data availability statement
The data that support the findings of this study are available from the corresponding author upon reasonable request.