
Figures & data
Table 1. Ingredient and calculated nutrient composition of the basal diet (as fed basis).
Table 2. Analysed nutrient composition of diets (as fed basis).
Table 3. Effect of hydrolysed yeast from Kluyveromyces fragilis (HK) supplementation on body weight, growth performance and diarrhoea incidence (DI) of weaned piglets overall the experimental period (0-21d)Table FootnoteA.
Table 4. Effect of hydrolysed yeast from Kluyveromyces fragilis (HK) supplementation on plasma antioxidant efficiency of weaned pigletsA.
Table 5. Effect of hydrolysed yeast from Kluyveromyces fragilis (HK) supplementation on plasma immunoglobulin of weaned pigletsA.
Figure 1. OTU Venn diagram. NC: basal diet without additive; PC: NC + 2 g/kg zinc oxide; HK1: NC + 7.5 g/kg hydrolysed yeast from Kluyveromyces fragilis; HK2: NC + 10 g/kg hydrolysed yeast from Kluyveromyces fragilis.
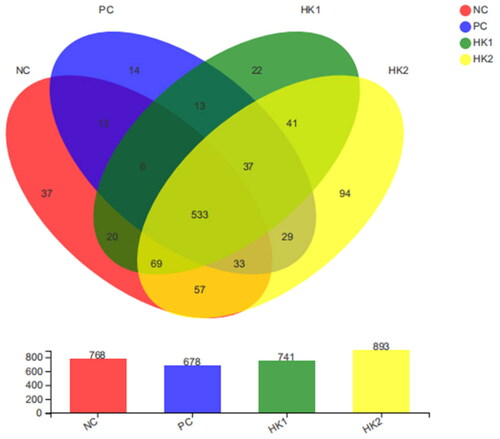
Table 6. Effect of hydrolysed yeast from Kluyveromyces fragilis (HK) supplementation on faecal microbiota α diversity of weaned pigletsA.
Figure 2. Faecal microbial β diversity (OTU level). NC: basal diet without additive; PC: NC + 2 g/kg zinc oxide; HK1: NC + 7.5 g/kg hydrolysed yeast from Kluyveromyces fragilis; HK2: NC + 10 g/kg hydrolysed yeast from Kluyveromyces fragilis.
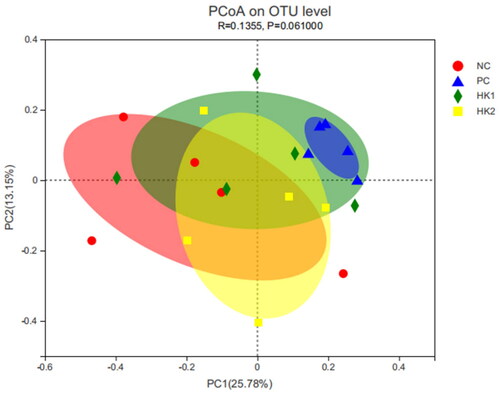
Figure 3. Relative abundance of species at the phylum (A) and genus (B) levels. The Y-axis represents the average relative abundance, the X-axis represents the different groups. NC: basal diet without additive; PC: NC + 2 g/kg zinc oxide; HK1: NC + 7.5 g/kg hydrolysed yeast from Kluyveromyces fragilis; HK2: NC + 10 g/kg hydrolysed yeast from Kluyveromyces fragilis.
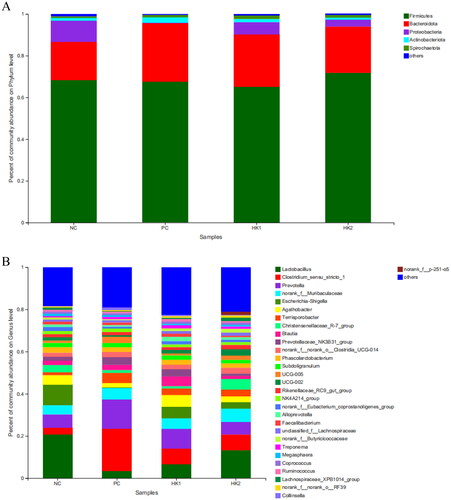
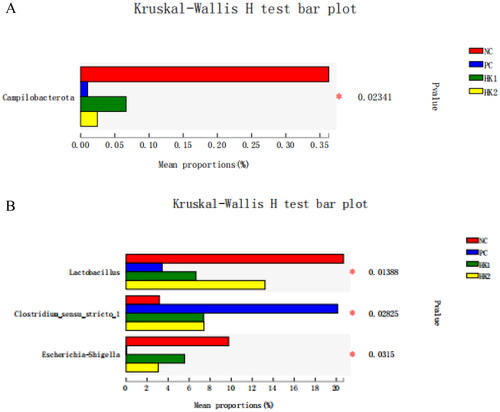
Figure 4. Significance test of difference between treatments at phylum (A) and genus (B) levels. The Y-axis represents the species names at a certain taxonomic level, the X-axis represents the average relative abundance in different groups of species, and the columns with different colours represent different groups; the far right is the p-value, *p < 0.05. NC: basal diet without additive; PC: NC + 2 g/kg zinc oxide; HK1: NC + 7.5 g/kg hydrolysed yeast from Kluyveromyces fragilis; HK2: NC + 10 g/kg hydrolysed yeast from Kluyveromyces fragilis.
Data availability statement
Datasets generated during and/or analysed during the current study are available from the corresponding author on reasonable request.