
Figures & data
Table 1. Descriptive statistics of farms characteristics and management traits (N = 28).
Table 2. Descriptive statistics of performance traits of dairy cows (N = 28).
Figure 1. Descriptive statistics of main constituents’ proportion and chemical composition of diets fed to lactating cows (N = 28) (Farms: n° of farms including the feeds category in the farm rations).
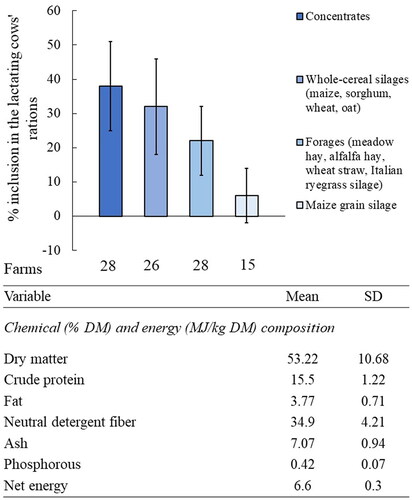
Figure 2. Raw means, standard deviations and hotspot analysis of impact categories per 1 kg fat- and protein-corrected milk (3.3% protein content, 4.0% fat content) for cereal-based dairy farms in Northern Italy (N = 28).
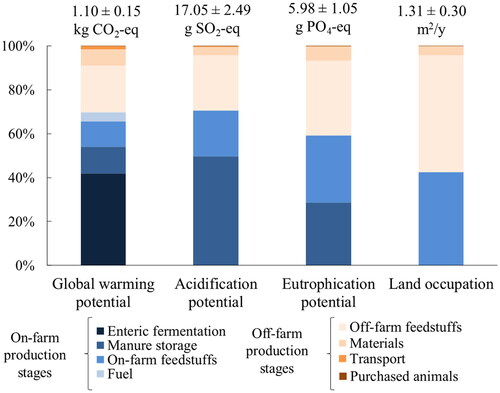
Figure 3. Least squares means and p-values of the linear (L) and quadratic (Q) trends of some farm management traits – stocking rate class (dairy cows/ha farm agricultural area) (A–D); feed self-sufficiency rate class (% share of the dry matter feed intake produced on farm) (E–H) – on the impact categories values. Milk corrected to 3.3% protein content and 4.0% fat content.
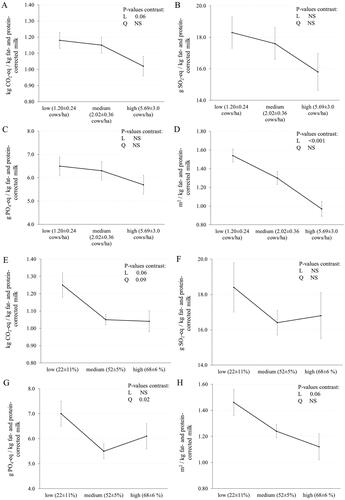
Figure 4. Least squares means and p-values of the linear (L) and quadratic (Q) trends of characteristics of rations fed to lactating cows – cereals silages (% dry matter – DM – intake from silages on total DM intake) (A–D); dietary crude protein content (% DM) (E–H) – on the impact categories values. Milk corrected to 3.3% protein content and 4.0% fat content.
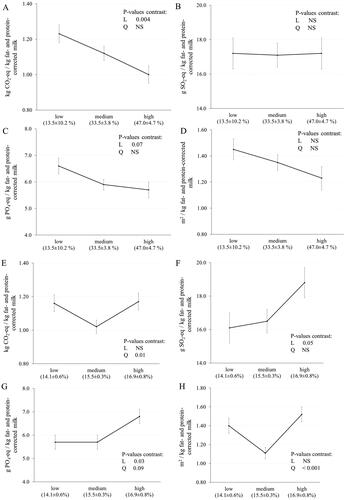
Figure 5. Least squares means and p-values of the linear (L) and quadratic (Q) trends of dairy cows response traits – yield of fat- and protein-corrected milk (kg/cow/305-d lactation) (A–D); replacement rate (%) (E–H); age at the first calving (months) (I-L) – on the impact categories values. Milk corrected to 3.3% protein content and 4.0% fat content. LSmeans with different superscripts within row differ significantly (p value < 0.05).
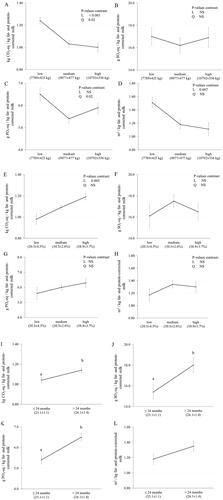
Figure 6. Least squares means and p-value of the linear (L) and quadratic (Q) trends of farm management traits (stocking rate class: dairy cows/ha farm agricultural area (A–E); feed self-sufficiency rate class-SELF%: % share of the dry matter intake produced on farm; (F–J)) on performance traits of dairy cows.
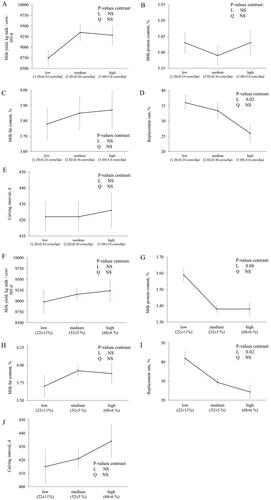
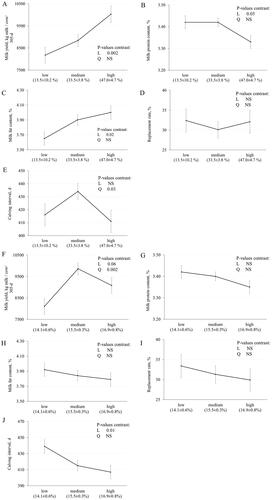
Figure 7. Least squares means and p-value of the linear (L) and quadratic (Q) trends of characteristics of rations fed to lactating cows (cereals silages: dry matter – DM – intake from silages on total DM intake, % (A–E); dietary crude protein (CP) content: % DM, (F–J)) on performance traits of dairy cows.
Supplemental Material
Download MS Word (94.2 KB)Data availability statement
The data presented in this study are available on request from the corresponding author upon reasonable request.