1,307
Views
1
CrossRef citations to date
0
Altmetric
Review Article

Biodiversity and genetics of beef quality, a review

ORCID Icon
Pages 867-884 | Received 04 Apr 2023, Accepted 17 May 2023, Published online: 22 Aug 2023

Figures & data

Table 1. Importance of genetic variability (Biodiversity) and genetic improvement (Genetics) for the phenotypic variability of the major traits affecting the product, process and overall quality of beef meat.

Figure 1. Contribution of different species to the worldwide production of meat (FAO Citation2020).

Figure 1. Contribution of different species to the worldwide production of meat (FAO Citation2020).

Figure 2. Number of breed entries of mammals and birds reared for food production worldwide retrieved from the FAO’s Domestic Animal Diversity Information System.

Figure 2. Number of breed entries of mammals and birds reared for food production worldwide retrieved from the FAO’s Domestic Animal Diversity Information System.

Figure 3. Median effective population sizes (Ne) of cattle breeds calculated on the basis of genealogical relationships (DF, 130 breeds) and the genomic linkage disequilibrium (LD, 60 breeds) according to census size (Nc) (adapted from Hall’s (Citation2016) data).

Figure 3. Median effective population sizes (Ne) of cattle breeds calculated on the basis of genealogical relationships (DF, 130 breeds) and the genomic linkage disequilibrium (LD, 60 breeds) according to census size (Nc) (adapted from Hall’s (Citation2016) data).

Figure 4. Trends in the average genomic inbreeding coefficients of Holstein bulls and cows according to their year of birth (simplified from Guinan et al. (Citation2023)).

Figure 4. Trends in the average genomic inbreeding coefficients of Holstein bulls and cows according to their year of birth (simplified from Guinan et al. (Citation2023)).

Figure 5. Distribution of heritability estimates of Warner-Bratzler shear force (in blue, 44 studies) and of tenderness scores (in red, 19 studies) of beef meat (data taken from Burrow et al. (Citation2001) review).

Figure 5. Distribution of heritability estimates of Warner-Bratzler shear force (in blue, 44 studies) and of tenderness scores (in red, 19 studies) of beef meat (data taken from Burrow et al. (Citation2001) review).

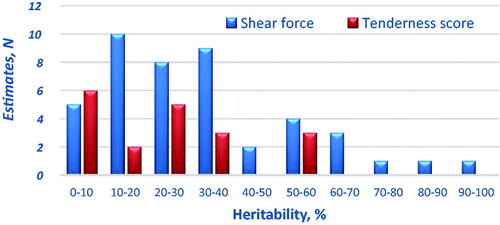
Table 2. Summary of the descriptive statistics and heritability estimates of beef quality traits obtained from studies carried out in the last 20 years (22 studiesTable Footnotea, 31 populations and 161,574 head).

Figure 6. Schema of approaches to improve meat quality (MQ) through: direct genetic selection from reference meat quality phenotypes at the nucleus level (red pathway); indirect genetic selection from NIRS MQ predictions (blue pathway); direct genetic selection of NIRS absorbances and genetic prediction of MQ (green pathway); indirect genomic selection through SNP MQ predictions (orange pathway) and direct genomic selection (brown pathway) (modified from Bittante, Savoia et al. (Citation2021)).

Figure 6. Schema of approaches to improve meat quality (MQ) through: direct genetic selection from reference meat quality phenotypes at the nucleus level (red pathway); indirect genetic selection from NIRS MQ predictions (blue pathway); direct genetic selection of NIRS absorbances and genetic prediction of MQ (green pathway); indirect genomic selection through SNP MQ predictions (orange pathway) and direct genomic selection (brown pathway) (modified from Bittante, Savoia et al. (Citation2021)).

Figure 7. Genetic (ra, dark colours) and residual (re, light colours) correlations between reference ‘wet chemistry’ beef quality traits and their predictions obtained with a transportable visible-near infrared (Vis-NIRS, in blue) or a very small portable near-infrared (Micro-NIRS, in green) spectrometer (data taken from Savoia et al. Citation2021). (L* = lightness; a* = redness index; b* = yellowness index; C* = chroma; H* = hue; PL = beef purge loss; CL = beef cooking loss; WBSF = Warner-Bratzler shear force of cooked meat).

Figure 7. Genetic (ra, dark colours) and residual (re, light colours) correlations between reference ‘wet chemistry’ beef quality traits and their predictions obtained with a transportable visible-near infrared (Vis-NIRS, in blue) or a very small portable near-infrared (Micro-NIRS, in green) spectrometer (data taken from Savoia et al. Citation2021). (L* = lightness; a* = redness index; b* = yellowness index; C* = chroma; H* = hue; PL = beef purge loss; CL = beef cooking loss; WBSF = Warner-Bratzler shear force of cooked meat).

Figure 8. Heritability estimates of beef quality traits measured using reference ‘wet chemistry’ methods (dark red) and their predictions obtained with a transportable visible-near infra-red (Vis-NIRS, in blue) or a very small portable near infrared (Micro-NIRS, in green) spectrometer (data taken from Savoia et al. (Citation2021)). (L* = lightness; a* = redness index; b* = yellowness index; C* = chroma; H* = hue; PL = beef purge loss; CL = beef cooking loss; WBSF = Warner-Bratzler shear force of cooked meat).

Figure 8. Heritability estimates of beef quality traits measured using reference ‘wet chemistry’ methods (dark red) and their predictions obtained with a transportable visible-near infra-red (Vis-NIRS, in blue) or a very small portable near infrared (Micro-NIRS, in green) spectrometer (data taken from Savoia et al. (Citation2021)). (L* = lightness; a* = redness index; b* = yellowness index; C* = chroma; H* = hue; PL = beef purge loss; CL = beef cooking loss; WBSF = Warner-Bratzler shear force of cooked meat).

Table 3. Summary of the major differences in F2 crossbred steers and heifers obtained from F1 bulls and dams (heterozygotes mh/+) sired by Piemontese bulls (homozygotes mh/mh) according to the number of mutated mh alleles inherited from the Piemontese grandsires.

Figure 9. Number of new publications per year related to genomic research on beef quality.

Figure 9. Number of new publications per year related to genomic research on beef quality.

Data availability statement

The data presented in this article are freely available being obtained from cited published articles.