
Figures & data
Figure 1. Pecora Nera del Mela sheep.
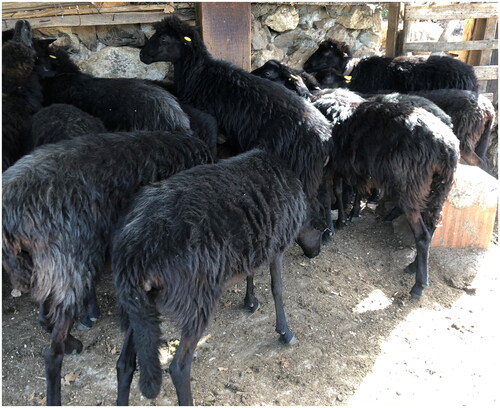
Table 1. Population’s full name (Name), acronyms (Code) and number of individuals after quality control of the 20 sheep populations included in the ITA and SIC datasets.
Table 2. Genetic diversity indices and run of homozygosity parameters for Nera del Mela sheep.
Figure 2. Pairwise FST values estimated between the 20 Italian sheep populations (ITA dataset). For full definition of the dataset, see Table .
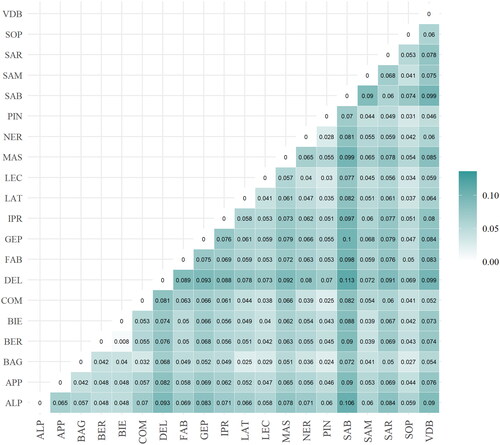
Figure 3. Multidimensional scaling analysis on the genotype data of the 20 Italian sheep populations (ITA dataset). For full definition of the dataset, see Table .
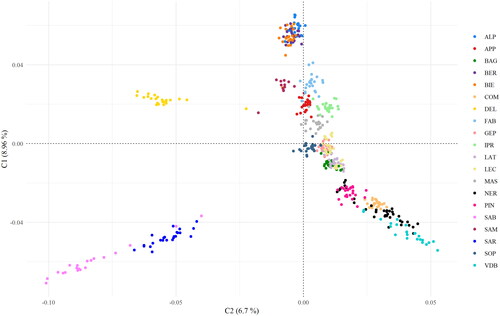
Figure 4. Neighbor-Joining Tree based on Allele Sharing Distances between the individuals of the 20 Italian populations of the ITA dataset. For full definition of the dataset, see Table .
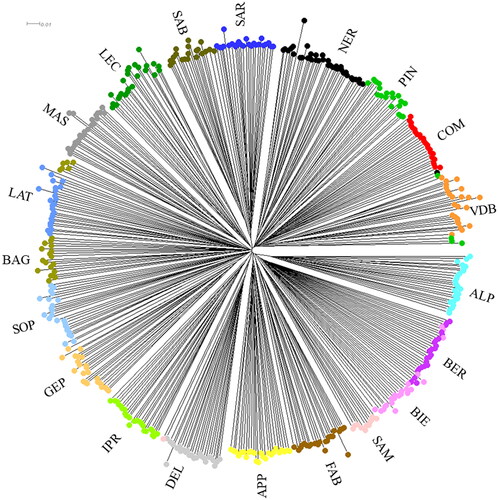
Figure 5. Multidimensional scaling analysis on the genotype data of the 5 Sicilian populations (SIC dataset). For full definition of the dataset, see Table .
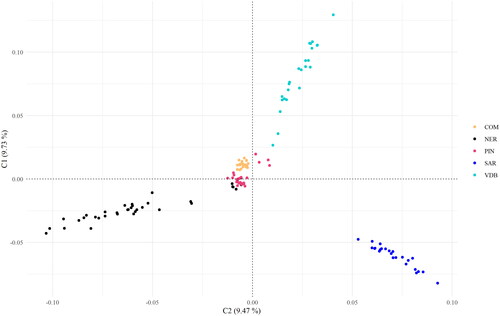
Figure 6. Neighbor-Joining Tree based on Allele Sharing Distances between the individuals of the 5 Sicilian populations (SIC dataset). For full definition of the dataset, see Table .
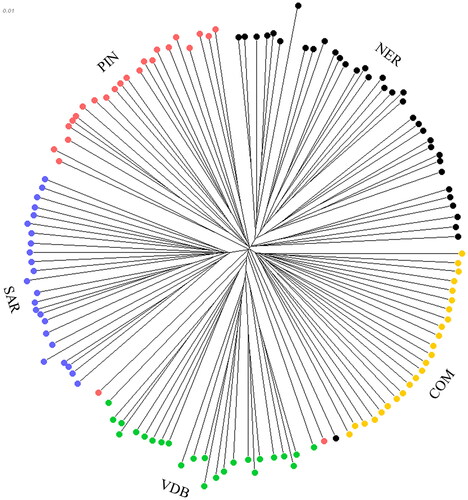
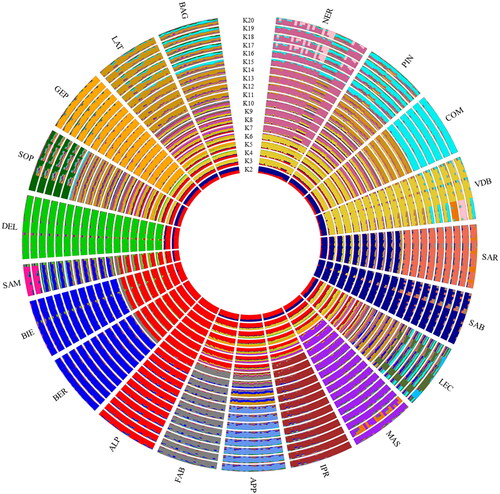
Figure 7. Circle plot of the ancestral clusters (K = 2–20) inferred by the Admixture analysis on the genotype data of the 20 Italian sheep populations (ITA dataset). For full definition of the dataset, see Table .
Supplemental Material
Download MS Word (39 KB)Supplemental Material
Download TIFF Image (626.5 KB)Supplemental Material
Download TIFF Image (27.7 KB)Data availability statement
The data that support the findings of this study are available upon request from the corresponding author.