
Figures & data
Table 1. Information for constituents in basal diet and nutritional value.
Table 2. Fatty acid profile in subcutaneous adipose tissue with inclusion of WEA (%).
Table 3. Fatty acid profile in visceral adipose tissue with inclusion of WEA (%).
Table 4. Top 10 expressed DE-miRNAs between sCON group and sWEA group.
Table 5. Top 10 expressed DE-miRNAs between pCON group and pWEA group.
Table 6. Top 10 expressed DE-miRNAs between sCON group and pCON group.
Figure 1. Cluster heatmap of differentially expressed mRNAs (DE-mRNAs) regarding lipid metabolism between different groups. (a) Lipid-related DE-mRNAs in subcutaneous adipose tissue between control (sCON) group and water extract of Allium mongolicum Regel (sWEA) group. (b) Lipid-related DE-mRNAs in visceral adipose tissue between control (pCON) group and water extract of Allium mongolicum Regel (pWEA) group. (c) Lipid-related DE-mRNAs between subcutaneous (sCON) and visceral (pCON) adipose tissue without WEA supplementation.
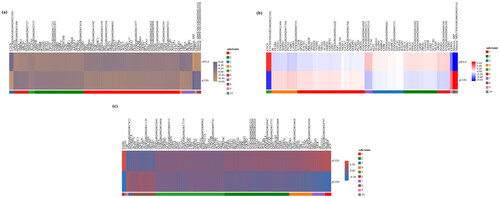
Figure 2. QRT-PCR results of randomly selected differentially expressed miRNAs (DE-miRNAs) and differentially expressed mRNAs (DE-mRNAs) in contrast to results of sequencing. (a) QRT-PCR and sequencing results in subcutaneous adipose tissue between control (CON) group and water extract of Allium mongolicum Regel (WEA) group. (b) QRT-PCR and sequencing results in visceral adipose tissue between CON group and WEA group, * indicates a significant difference with a p value less than 0.05.
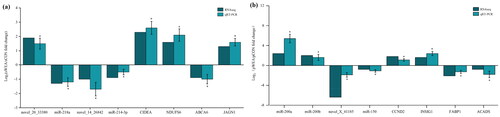
Figure 3. The top 50 enriched GO terms for intersection genes from target genes of differentially expressed miRNAs (DE-miRNAs) and actual differentially expressed mRNAs (DE-mRNAs). (a) GO terms for intersection genes between sCON group and sWEA group. (b) GO terms for intersection genes between pCON group and pWEA group. (c) GO terms for intersection genes between sCON group and pCON group.
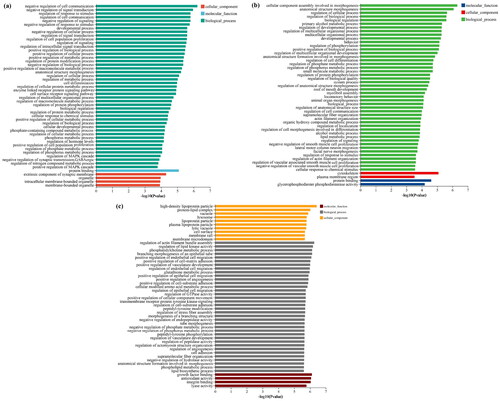
Figure 4. The top 20 enriched KEGG pathways for intersection genes from target genes of DE-miRNAs and actual DE-mRNAs. (a) Enriched KEGG pathways for intersection genes between sCON group and sWEA group. (b) Enriched KEGG pathways for intersection genes between pCON group and pWEA group. (c) Enriched KEGG pathways for intersection genes between sCON group and pCON group.
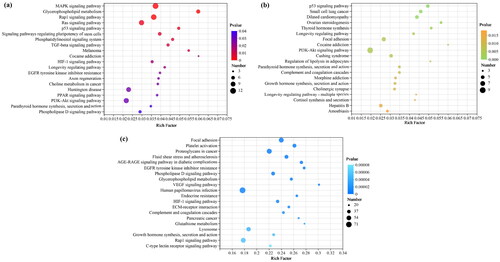
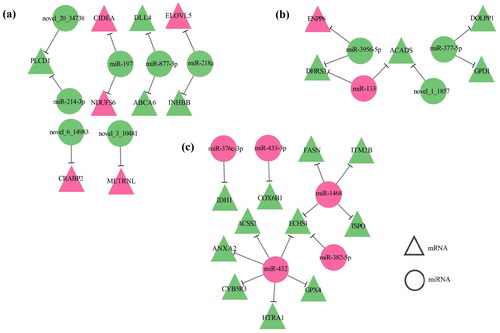
Figure 5. MiRNA-mRNA network with regard to lipid metabolism. (a) Differential miRNA-mRNA network diagram between sCON group and sWEA group. (b) Differential miRNA-mRNA network diagram between pCON group and pWEA group. (c) Differential miRNA-mRNA network diagram between sCON group and pCON group. Pink represents up-regulation, green represents down-regulation.
Supplemental Material
Download (1.8 MB)Data availability statement
Raw data for sequencing can be accessed by NCBI BioProject database with identifer PRJNA894801.