
Figures & data
Table 1. Chemical composition of the experimental diet.
Figure 1. Ultrasonograms of genital tracts of non-pregnant ewes; (A–D) Sagittal section in the uterine horn, and uterine with clear hypoechogenicity, and scanty amount of fluid. (E–H) Follicular phase, large sized follicle (≤4mm), and small sized follicles (≤2mm). (J) Luteal phase, Corpus luteum, (≤0.5 mm).
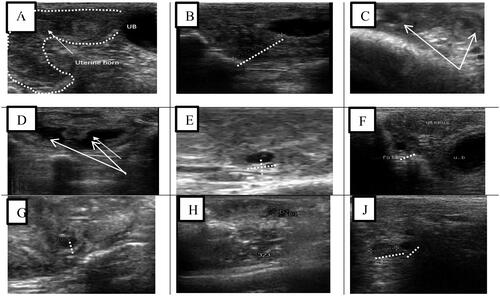
Table 2. The follicular population (small and large follicles), diameter of corpora lutea, and of the uterine horns in control and treated groups after 48 h of sponge removal (n = 30, Mean ± SE).
Table 3. The follicular population (small and large follicles), diameter of corpora lutea, and of the uterine horns in control and treated groups after 72 h of sponge removal (n = 30, Mean ± SE).
Table 4. Oestrous duration, onset, response and fertility rate in control and treated groups (n = 30, Mean ± SE).
Figure 2. Ultrasonograms of genital tracts of pregnant ewes; (A–C) Pregnant ewe at 35th day, (D) beginning of ossification in the head; pregnant ewe at 60th–70th day, (E,F) all foetal parts are clear, umbilical cord; pregnant ewe at 60th–70th day, (G, H) placentome, (J) ribs shadow, heart location.
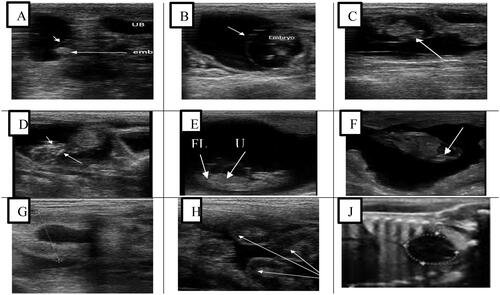
Table 5. The measurements of the placentomes, chest, bipartitely diameter, and orbit in control and treated groups at 60–70 d after mating (n = 6/group, Mean ± SE).
Table 6. Progesterone concentration (ng/mL) in the control and treated groups during oestrous days and pregnancy months (n = 30 ewes. Mean ± SE).
Table 7. Serum Biochemical parameters in the control and treated groups during oestrous days after 0, 24, 48, and 72 h of sponge removal (n = 30 ewes. Mean ± SE).
Data availability statement
Raw data were generated at the Experimental Sheep Farm belonging to the Faculty of Agriculture, Al-Azhar University, Assuit, Egypt. Data availability statement: The raw data supporting the conclusions of this article will be made available by the authors, without undue reservation.