
Figures & data
Figure 1. STRING database analysis of differentially abundant mitochondrial proteins in dark-cutting vs. normal-pH beef. Mitochondrial protein expression changes induced by the dark-cutting condition in subnetworks identified were compared with normal-pH beef. Red and green colours represent up-regulated and down-regulated proteins (p ≤ 0.05) in dark-cutting beef mitochondrial proteome relative to normal-pH beef. Proteins in clustered circles exhibit protein–protein interactions, while those outside the clusters show no protein–protein interactions. Adapted from Journal of Proteomics, 2022, 265:104637 https://doi.org/10.1016/j.jprot.2022.104637
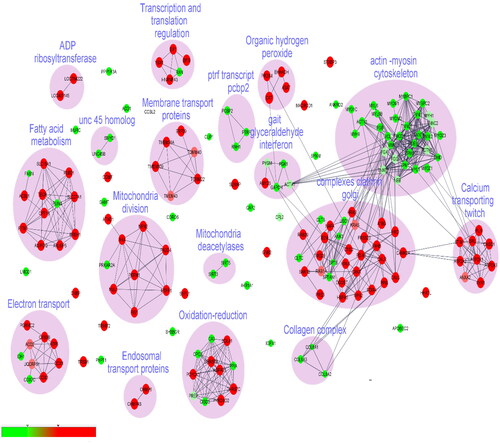
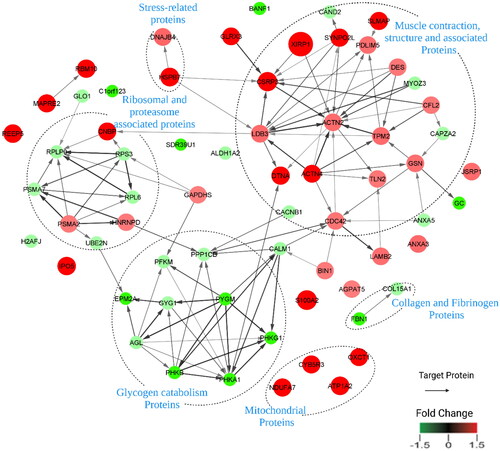
Figure 2. STRING database analysis of proteins up-and down-regulated in dark-coloured beef at slightly elevated pH vs. normal-pH beef. The proteins with significant changes in protein abundance between dark-coloured beef at slightly elevated pH vs. normal-pH samples were used to query potential protein–protein interactions in the string database as described in the methods. Protein interactions were confirmed with connections, while non-interacting proteins had no connections between them. The red colour represents overabundant proteins and the green colour represents less abundant proteins in dark-coloured beef at slightly elevated pH vs. normal-pH beef. The size of the circle represents fold change in abundance, while the arrowheads indicate the target of the protein interactions. Adapted from Journal of Animal Science, Journal of Animal Science, 2023, 101, 1–12 https://doi.org/10.1093/jas/skac376
Data availability statement
The data presented in this study are available on request from the corresponding author upon reasonable request.