
Figures & data
Table 1. Composition of the two experimental diets (CTRL and HEMP).
Table 2. Nutrient profile of experimental diet (% as fed). Data express the percentage of nutrients in the experimental diets.
Figure 1. Digestibility of experimental diets. The figure shows the result obtained from the in vitro digestibility of the two experimental diets. Data are shown as means and standard error. *An asterisk indicates statistically significant differences among the experimental diets (treatment p = .0353).
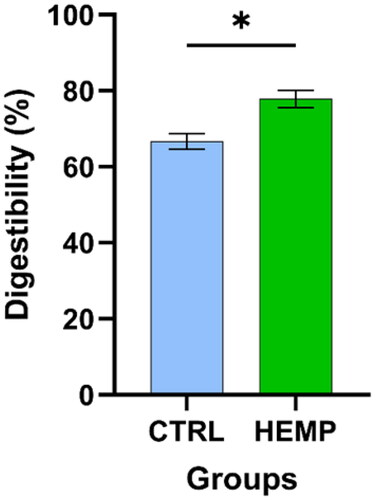
Figure 2. Body Conditional Score (BCS) and Percentage of Body Fat. (a) Body Conditional Score, evaluated at T0 and T2 for both experimental groups (CTRL and HEMP). (b) Percentage of body fat, calculated from morphometric measurements, at T0 and T2 for both experimental groups (CTRL and HEMP). Data are shown as means and standard error.
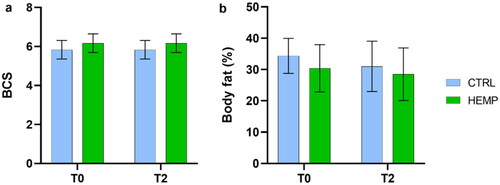
Figure 3. The figure shows the average weight of the experimental groups (CTRL and HEMP) at time points (T0 and T2). Data are shown as means and standard error.
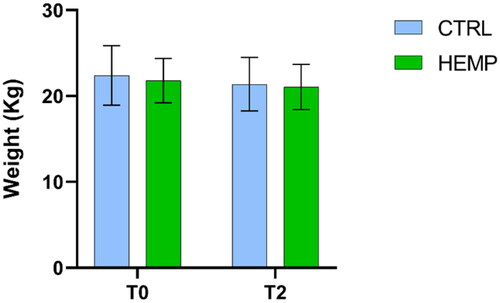
Figure 4. Apparent digestibility. (a) Total apparent digestibility; (b) Protein apparent digestibility. Data are shown as means and standard error. Means followed by an asterisk with different superscripts are significantly different, *p < .0395, **p < .0032, ***p < .0010, ****p < .0001.
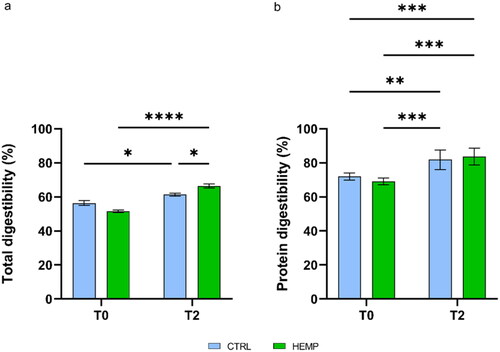
Figure 5. Oxidative status of serum. (a) Oxy test; (b) d-ROMS test. Data are shown as means and standard error. Means followed by an asterisk with different superscripts are significantly different, **p = .0011, ****p < .0001.
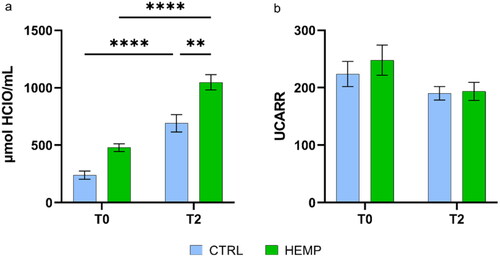
Figure 6. Boxplots of alpha-diversity indexes. Boxplots represent treatment by timepoint through four different indexes (Chao1; ACE; Shannon; Simpson) of gut microbiota of the two experimental groups (CTRL and HEMP).
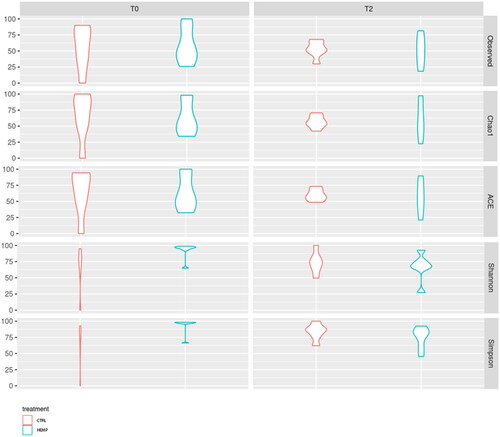
Figure 7. Beta-diversity Non-Metric Multidimensional Scaling (NMDS). (a) Data clustered by treatment (p-value = .85374). (b) Data clustered by time point (p-value = .0092818). (c) Data clustered by treatment x time point (p-value = .77844).
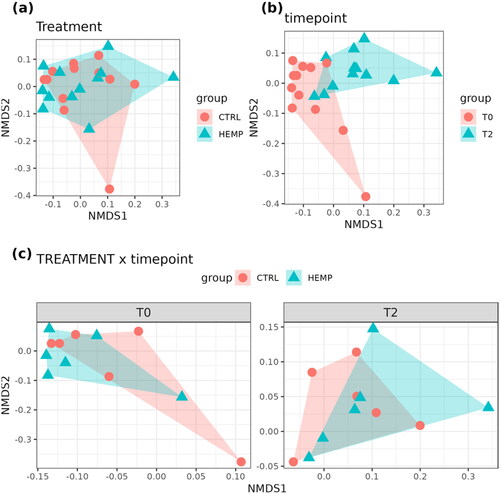
Figure 8. Relative abundance (percentages) of phyla detected in both CTRL and HEMP groups at T0 and T2.
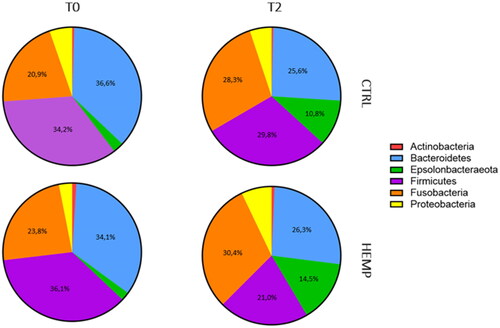
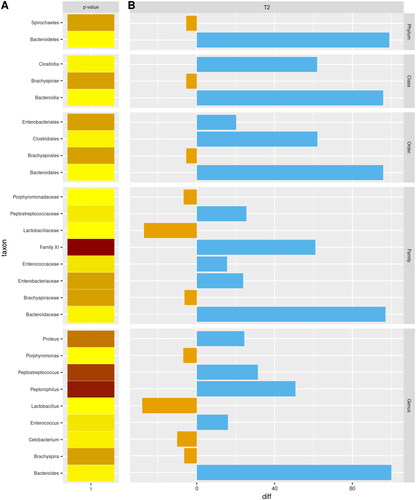
Figure 9. The taxa found on day 28 (T2) grouped into different phylogenetic levels with the relative abundance for each bacterial group. The intensity of the colour (from light yellow to burgundy red) is directly proportional to the statistical significance of the data.
Supplemental Material
Download MS Word (20.6 KB)Data availability
The authors confirm that the data supporting the findings of this study are available within the article [and/or] its supplementary materials.