
Figures & data
Figure 1. Number of calves sold by year and its percentage partition among breeds within year. *N: Total number of sold calves for respective year; values in brackets highlight the respective trend within each cattle breed
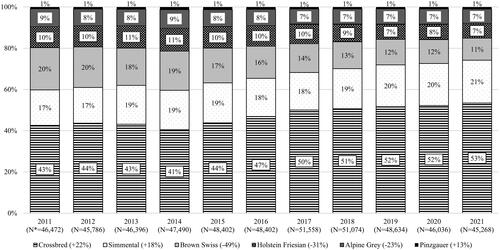
Figure 2. Mean auction price (€/kg liveweight) of calves by breed and year.
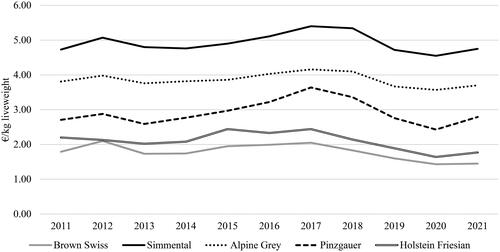
Table 1. Results of the ANOVA for the different traits considered in the analysis of the dataset on calves’ quality at auctions.
Table 2. Least-square means of the selling parameters the auctions for purebred calves of different breeds.
Table 3. Gender difference in liveweight and auction price for calves of different breeds.
Table 4. Number of calves within breed according to use of pasture by their dams during the last 90 days of gestation.
Table 5. Results of the ANOVA for the different traits considered in the analysis of the dataset used to assess the effect of dam’s grazing during the last three months of gestation on calves’ quality at auctions.
Table 6. Least square means of the interaction between breed and grazing during the last 90 days of gestation for of calves selling parameters at auctions.
Data availability statement
The data that support the findings of this study are available on request from the corresponding author, Dr Thomas Zanon. The data are not publicly available due to privacy/ethical restrictions.