
Figures & data
Figure 1. Grazed area with main habitat types. The external red line delimits a raster map (25 m resolution) encompassing all the GPS locations plus an external buffer of 50 m. The habitats are mapped as vectors at a fixed scale of 1:2500 (see main text for details).
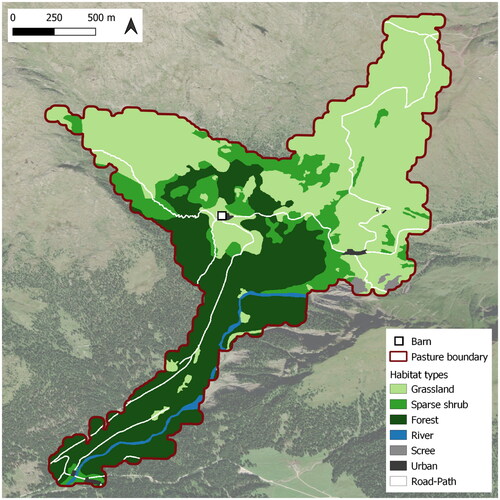
Figure 2. Effects of breed-parity on the hours spent grazing (A and B panels), resting (C and D panels) and walking (E and F panels) during ‘day’ and ‘night’. ‘BrM’: Brown Swiss multiparous; GrM: Alpine Grey multiparous; GrP: Alpine Grey primiparous. Whiskers indicate 95% confidence intervals. For details of the parametric coefficients of the statistical models see Supplementary Table S.2.1.
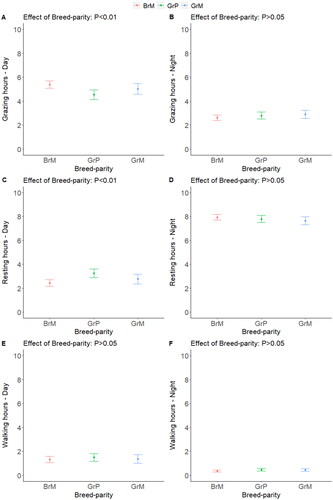
Figure 3. Estimated probability of using different habitats as a function of the interactions between behaviour and day time period (panel A) and behaviour and breed-parity (panel B). G: grazing; R: resting; W: walking. G: grazing; R: resting; W: walking. BrM: Brown Swiss multiparous; GrP: Alpine Grey primiparous; GrM: Alpine Grey multiparous. See Table S.2.2 for the model’s parameters.
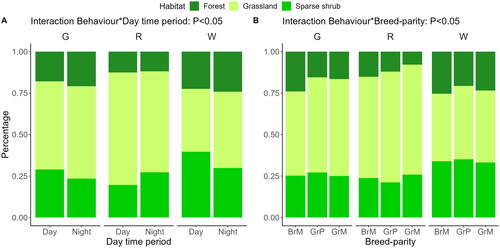
Figure 4. Maps of the intensity of fine-scale spatial use of the pasture area by all the cows, normalised as proportion of the maximum number of locations per pixels, during the whole day (panel A) and during the day-periods ‘day’ (panel B) and ‘night’ (panel C), and when grazing (panel D), resting (panel E) and walking (panel F).
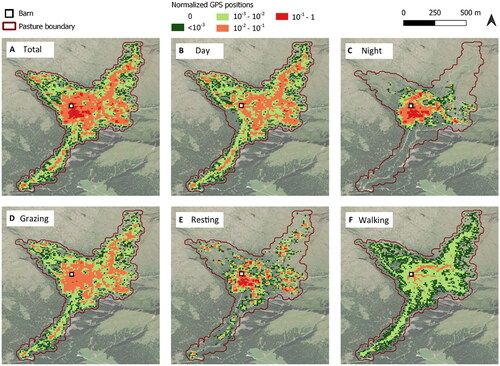
Figure 5. Estimated effects of prevalent habitat type (grassland, sparse shrub and forest), distance from barn, slope, and breed-parity (BrM: Brown Swiss multiparous; GrM: Alpine Grey multiparous; GrP: Alpine Grey primiparous) on intensity of pasture use during ‘day’ (panel A) and ‘night’ (panel B). horizontal whiskers indicate 95% credibility intervals of posterior estimates, which differ significantly when whiskers do not overlap with the dotted line at estimate = 0. The asterisks (*) indicate statistical relevance. The INLA (Integrated Nested Laplace Approximation) structured spatial effect was based on a Gamma prior to τs with shape 1 and rate 0.00025. For details of the parametric coefficients of the statistical models see Supplementary Table S.2.3.
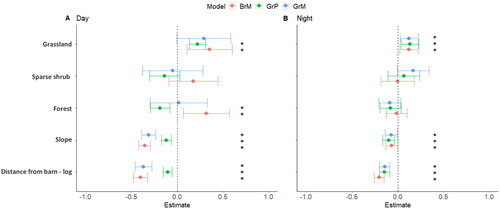
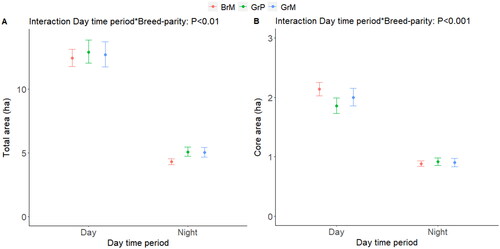
Figure 6. Effects of the 2-way interaction between breed-parity and day-period on the surface (ha) of total areas (90% of locations, panel A) and core areas (50% of locations, panel B; note that the scale of the y axis differs from that of panel a). Whiskers indicate 95% confidence intervals. BrM: Brown Swiss multiparous; GrM: Alpine Grey multiparous; GrP: Alpine Grey primiparous. For details of the parametric coefficients of the statistical models see Supplementary Table S.2.4.
Supplemental Material
Download MS Word (4.2 MB)Data availability statement
The data of this study are freely available from the corresponding author upon request. The data are not publicly available due to the involvement of private partners (farmers).