
Figures & data
Table 1. Substrate consumed per gram of diet on a fresh matter (DM) basis, feed conversion efficiency (ECI) on a dry matter basis and feed conversion ratio (FCR) on a fresh matter basis.
Figure 1. Percentage of survival rate of larvae in control (CTRL) and treatment (TRT) group over 14 days of the trial. All values are listed as mean ± standard deviations. *Asterisk indicates statistically significant differences between tested groups (Unpaired Student’s t-test p < 0.05).
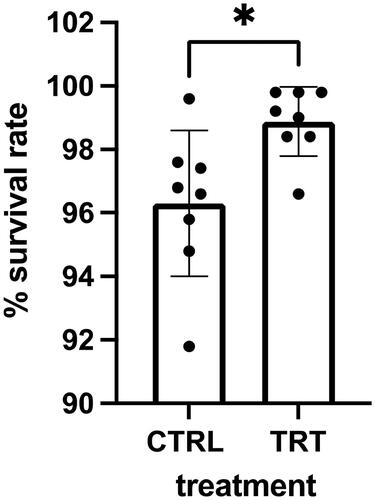
Table 2. Chemical analysis of control (CTRL) and treatment (TRT) group growing substrates administered at day 0 of the trial and residual growth substrates collected at day 14.
Figure 2. Antioxidant activity of residual growing substrates extracts at three different concentrations (100%; 50%; 25%) in the treatment (TRT) and the control (CTRL) groups. All values are listed as mean ± standard deviations. * Asterisks indicate statistically significant differences between tested groups (p < 0.05).
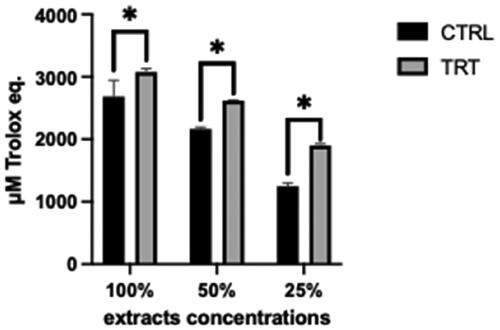
Table 3. Nutritional composition of insect meals in the control (CTRL) and the treatment (TRT) groups.
Table 4. Lightness (L*), red/green (a*) and yellow/blue (b*) results of control and treatment insect meals groups.
Figure 3. Evaluation of growth inhibition of O138 E. coli of insect meals in the control (CTRL) and the treatment (TRT) groups for six hours after the inoculation. Data were analysed using two-way ANOVA, and shown as means and standard deviations. * Asterisks indicate statistically significant differences among tested groups (p < 0.01). T0: 0 hours; T1: 1 hour; T2: 2 hours; T3: 3 hours; T4: 4 hours; T5: 5 hours; T6: 6 hours.
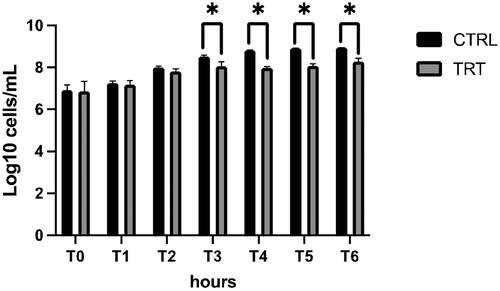
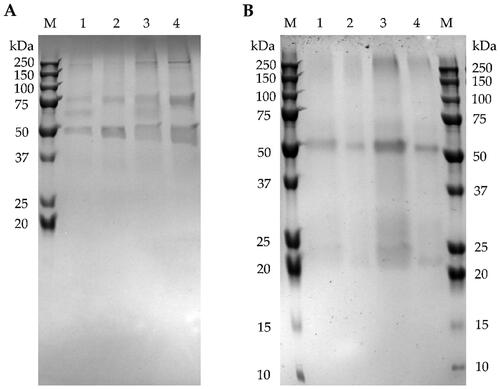
Figure 4. SDS-PAGE of soluble proteins extracted from insect meals and residual substrates at day 14 of the control (CTRL) and treatment (TRT) groups. (A) Soluble proteins extracted from insect meals. M: Molecular weight marker (Precision Plus Protein, Bio-Rad, Hercules, CA, USA); Lane 1: 8 µg of soluble proteins of the CTRL group; Lane 2: 4 µg of soluble proteins of the CTRL group; Lane 3: 8 µg of soluble proteins of the TRT group; Lane 4: 4 µg of soluble proteins of the TRT group. (B) Soluble proteins extracted from residual substrates after 14 days of trial. M: Molecular weight marker (Precision Plus Protein, Bio-Rad, Hercules, CA, USA); Lane 1: 5 µg of soluble proteins of the CTRL group; Lane 2: 2.5 µg of soluble proteins of the CTRL group; Lane 3: 5 of soluble proteins of the TRT group; Lane 4: 2.5 of soluble proteins of theTRT group.
Data availability statement
All data are available within the manuscript.