
Figures & data
Figure 1. A) Graphical representation of Principal Component Analysis (PCA) result for the three breeds (ARP, ABC and ACH): Principal component 1 (PC_1) vs Principal Component 2 (PC_2) are plotted; B) Graphical representation of Principal Component Analysis (PCA) result limited to ABC and ACH: Principal component 1 (PC_1) vs Principal Component 2 (PC_2) are plotted; C) Aosta breeds Wright’s fixation index - FST.
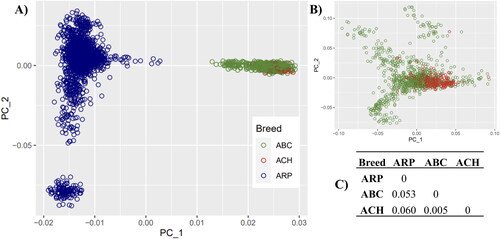
Figure 2. Effective population size (Ne) per generation ago for the ARP and ABCH breeds.
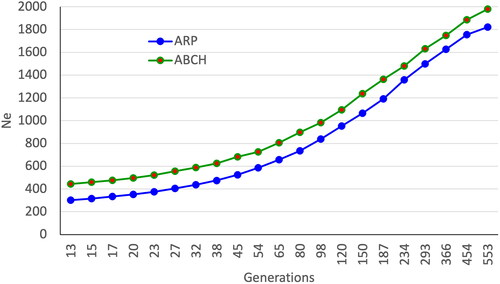
Table 1. Minimum (MIN), maximum (MAX), and average (AVG) values for inbreeding coefficients calculated for the Aosta population.
Table 2. Minimum (MIN), maximum (MAX), and average number (AVG) and length (in bps) of Runs of Homozygosity (ROH) identified in the Aosta population.
Figure 3. Manhattan plots of the SNPs incidence. Red lines threshold represents the top 1% of SNP defining the ROH_islands.
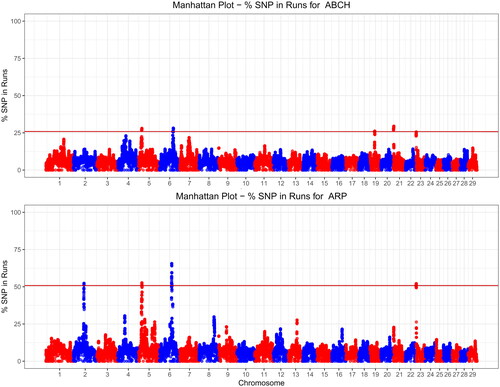
Table 3. ROH_Islands identified in the ARP breed, with genes mapped in the ROH and associated QTL.
Table 4. ROH_Islands identified in the ABCH breed, with genes mapped in the ROH and associated QTL.
Table 5. Genotypic frequencies for milk proteins and the lactoferrin loci.
Table 6. Genotypic frequencies at loci related to meat quality traits.
Table 7. Genotypic frequencies for fertility traits.
Supplemental Material
Download MS Excel (20.9 KB)Supplemental Material
Download MS Excel (12 KB)Supplemental Material
Download TIFF Image (53.9 MB)Data availability statement
The data supporting the conclusions of this manuscript are included in the Supplementary Materials.